Salaries by Location

Average Salary in Hangzhou China - TeamedUp China

Average Salary in Hangzhou China: Local Data Breakdowns (2024)

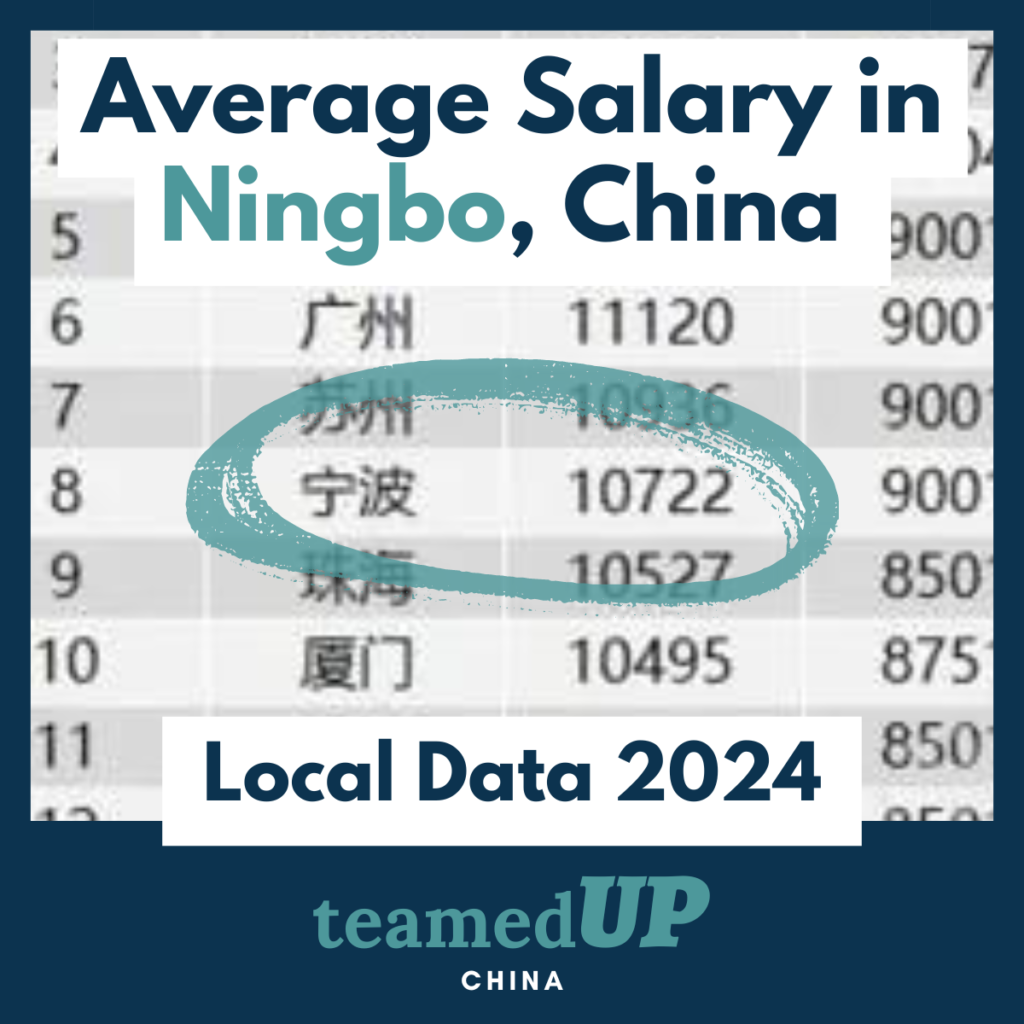
The eastern city of Hangzhou is one of the largest in China and a major economic hub. Today we’re breaking down multiple sources of public, local data to see what the average salary level really is in this megacity. So let’s get to it! A dive into some 2024 salary data from Hangzhou, the city that Alibaba calls home…   💡 Why not use data from international sources, you ask? When it comes to salary figures in China, we’ve found a big discrepancy in the data provided by most outlets. Hiring in China? We can help. Post open roles across China’s top job sites, classifieds, and networking platforms — lower hiring costs by over 80%. Edit Template Average Salary in Hangzhou: Government Data Hangzhou Statistics Bureau In July 2024, Hangzhou’s Statistics Bureau[1] released its most recent data on salaries. The figures represent wage data collected throughout 2023. They specifically split up the data into private and non-private categories.  Non-Private Jobs Average annual income: ¥158,121 RMB ($22,341 USD) Average monthly income: ¥13,176 RMB ($1,861 USD)   Private Jobs Average annual income: ¥89,016 RMB ($12,577 USD) Average monthly income: ¥7,418 RMB ($1,048 USD) Data considerations The report also specifies what exactly the term ‘total wages‘ means here: Total wages refer to the total amount of labor remuneration directly paid to employees of the unit during the reporting period (quarter or year). It includes time wages, piece wages, bonuses, allowances and subsidies, overtime wages, and wages paid under special circumstances. The total wage is the pre-tax wage, including personal income tax, social insurance funds, housing provident fund and other personal contributions. On private vs non-private categories: Private legal entities specifically include: private limited liability companies, private joint stock companies, sole proprietorships and partnerships among domestic enterprises. Non-private legal entities in urban areas specifically include: domestic-funded (including government agencies and public institutions) units other than private units, Hong Kong, Macao and Taiwan-invested enterprises, and foreign-invested enterprises. The data collection method seems to be a self-reported survey, likely required for submission by legal entities (as this is a government bureau after all): A comprehensive survey method is adopted for legal entities that use one set of forms, and a sampling survey method is adopted for legal entities that do not use one set of forms. Average Salary in Hangzhou: Local HR Data Hangzhou Salary Data (Zhilian Zhaopin) Local HR giant Zhaopin regularly releases salary data for cities across China. The above photo shows the top 38 cities’ average and median salary levels in Q2 2024. Hangzhou came in at the #4 spot with an average monthly salary of ¥11,909 RMB ($1,682 USD)/month. Hangzhouo’s median salary here is ¥9,904 RMB ($1,399 USD)/month.   Compared to Other Top Cities Shanghai took the first spot with an average monthly salary of ¥13,732 RMB ($1,933 USD)/month. Beijing ranked second with an average monthly salary of ¥13,351 RMB ($1,874 USD)/month. Shenzhen comes in at the #3 spot with an average monthly salary of ¥12,799 RMB ($1,796 USD)/month. Hangzhou, Nanjing, Guangzhou, Suzhou, and Ningbo round out the top 8. We also have median salary data here and can see the median of the top 3 cities – Shanghai, Beijing, and Shenzhen – all exceeded ¥10,000 RMB ($1,393 USD)/month. The median of the top 8 cities (including Hangzhou) all exceeded ¥9,000 RMB ($1,271 USD)/month It’s also interesting to note that there is a 59% difference in the median salary between the first (Shanghai) and last (Harbin) cities on this list. Related Resources: Average Salary in Shenzhen China: Local Data Breakdowns (2024) Salary Data for 8 of China’s Leading Tech Companies (2024) Average Salary Ranges for New University Graduates in China Top 10 Highest Paying Cities in China (2024) Average Salary in China: Local Data 2023+2024 Hiring in China? We can help, and likely lower your hiring costs by over 80% We’ve been recruiting in China since 2014! Our China Candidate Sourcing Service helps companies post & promote open roles across top Chinese jobs & networking platforms. Let’s find your next great China-based team member together.  Book A Call Post a Job Contact us to discuss hiring goals, salary & compensation budgets, and if TeamedUp China is the right fit to support your organization. New here? Get 25% off your first job post with us. Edit Template

Average Salary in Hangzhou China: Local Data Breakdowns (2024) Read More »
Average Salary in Xi'an China - TeamedUp China

Average Salary in Xi’an China: Local Data Breakdowns (2024)

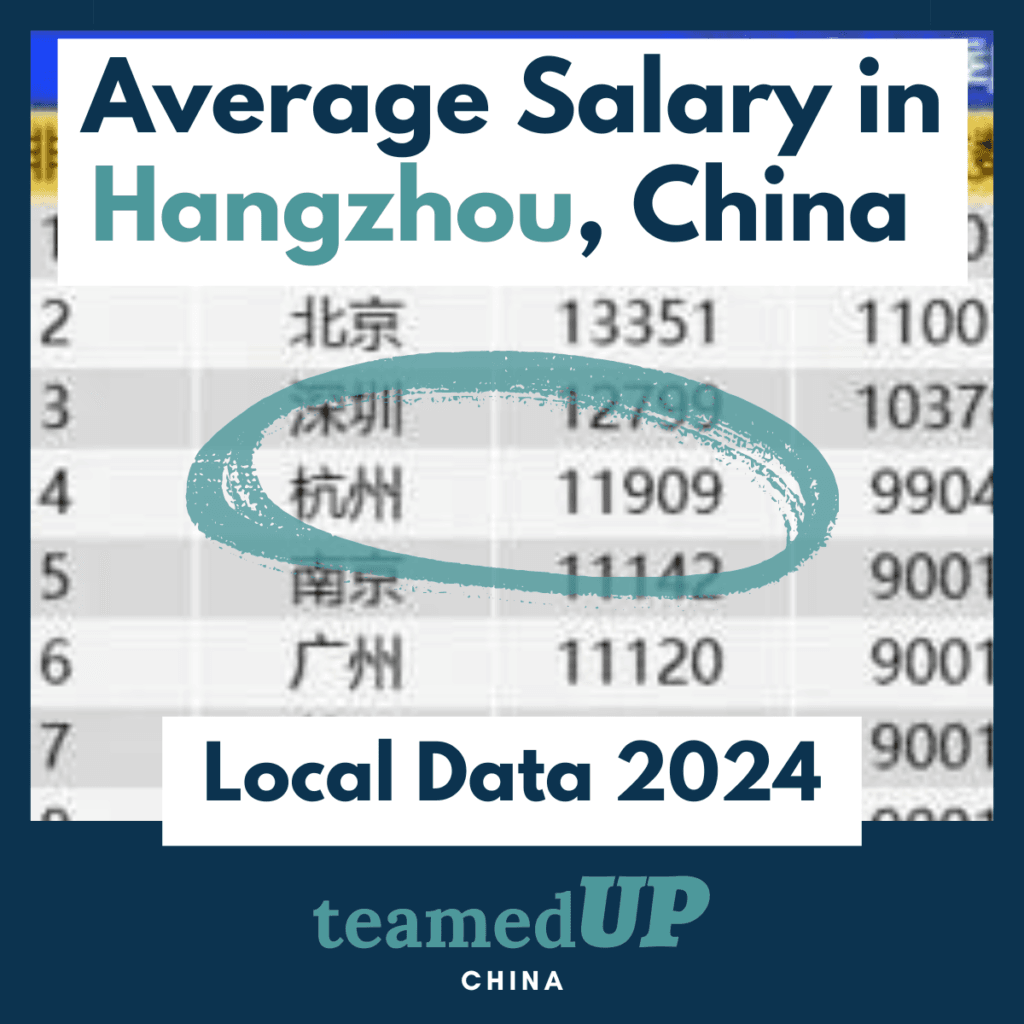
The ancient central city of Xi’an is one of the largest in China and a major modern economic hub. Today we’re breaking down multiple sources of public, local data to see what the average salary level really is in this megacity. So let’s get to it! A dive into some 2024 Xi’an salary data…   💡 Why not use data from international sources, you ask? When it comes to salary figures in China, we’ve found a big discrepancy in the data provided by most outlets. Hiring in China? We can help. Post open roles across China’s top job sites, classifieds, and networking platforms — lower hiring costs by over 80%. Edit Template Average Salary Xi’an: Government Data Xi’an Statistics Bureau In July 2024, Xi’an’s Statistics Bureau[1] released its most recent data on salaries. The figures represent wage data collected throughout 2023. The salary figures represent private units only (definition below).   Average annual salary: ¥68,007 RMB ($9,608 USD) Average monthly salary: ¥5,667 RMB ($800 USD) Year-on-year increase: 7.8% Data considerations The report also specifies what exactly the term ‘total wages‘ means here: Total wages refer to the total amount of labor remuneration directly paid to employees of the unit during the reporting period (quarter or year). It includes time wages, piece wages, bonuses, allowances and subsidies, overtime wages, and wages paid under special circumstances. The total wage is the pre-tax wage, including personal income tax, social insurance funds, housing provident fund and other personal contributions. On private vs non-private categories: Private legal entities specifically include: private limited liability companies, private joint stock companies, sole proprietorships and partnerships among domestic enterprises. Non-private legal entities in urban areas specifically include: domestic-funded (including government agencies and public institutions) units other than private units, Hong Kong, Macao and Taiwan-invested enterprises, and foreign-invested enterprises. The data collection method seems to be a self-reported survey, likely required for submission by legal entities (as this is a government bureau after all): A comprehensive survey method is adopted for legal entities that use one set of forms, and a sampling survey method is adopted for legal entities that do not use one set of forms. Average Salary in Xi’an: Local HR Data Xi’an Salary Data (Zhilian Zhaopin) Local HR giant Zhaopin regularly releases salary data for cities across China. The above photo shows the top 38 cities’ average and median salary levels in Q2 2024. Xi’an came in at the #20 spot with an average monthly salary of ¥9,349 RMB ($1,320 USD)/month. Xi’an’s median salary here is ¥7,501 RMB ($1,059 USD)/month.   Compared to Other Top Cities Shanghai took the first spot with an average monthly salary of ¥13,732 RMB ($1,933 USD)/month. Beijing ranked second with an average monthly salary of ¥13,351 RMB ($1,874 USD)/month. Shenzhen comes in at the #3 spot with an average monthly salary of ¥12,799 RMB ($1,796 USD)/month. Hangzhou, Nanjing, Guangzhou, Suzhou, and Ningbo round out the top 8. We also have median salary data here and can see the median of the top 3 cities – Shanghai, Beijing, and Shenzhen – all exceeded ¥10,000 RMB ($1,393 USD)/month. The median of the top 31 cities (including Xi’an) all exceeded ¥7,000 RMB ($989 USD)/month It’s also interesting to note that there is a 59% difference in the median salary between the first (Shanghai) and last (Harbin) cities on this list. Related Resources: Average Salary in Shenzhen China: Local Data Breakdowns (2024) Salary Data for 8 of China’s Leading Tech Companies (2024) Average Salary Ranges for New University Graduates in China Top 10 Highest Paying Cities in China (2024) Average Salary in China: Local Data 2023+2024 Hiring in China? We can help, and likely lower your hiring costs by over 80% We’ve been recruiting in China since 2014! Our China Candidate Sourcing Service helps companies post & promote open roles across top Chinese jobs & networking platforms. Let’s find your next great China-based team member together.  Book A Call Post a Job Contact us to discuss hiring goals, salary & compensation budgets, and if TeamedUp China is the right fit to support your organization. New here? Get 25% off your first job post with us. Edit Template

Average Salary in Xi’an China: Local Data Breakdowns (2024) Read More »
Average Salary in Ningbo China - TeamedUp China

Average Salary in Ningbo China: Local Data Breakdowns (2024)

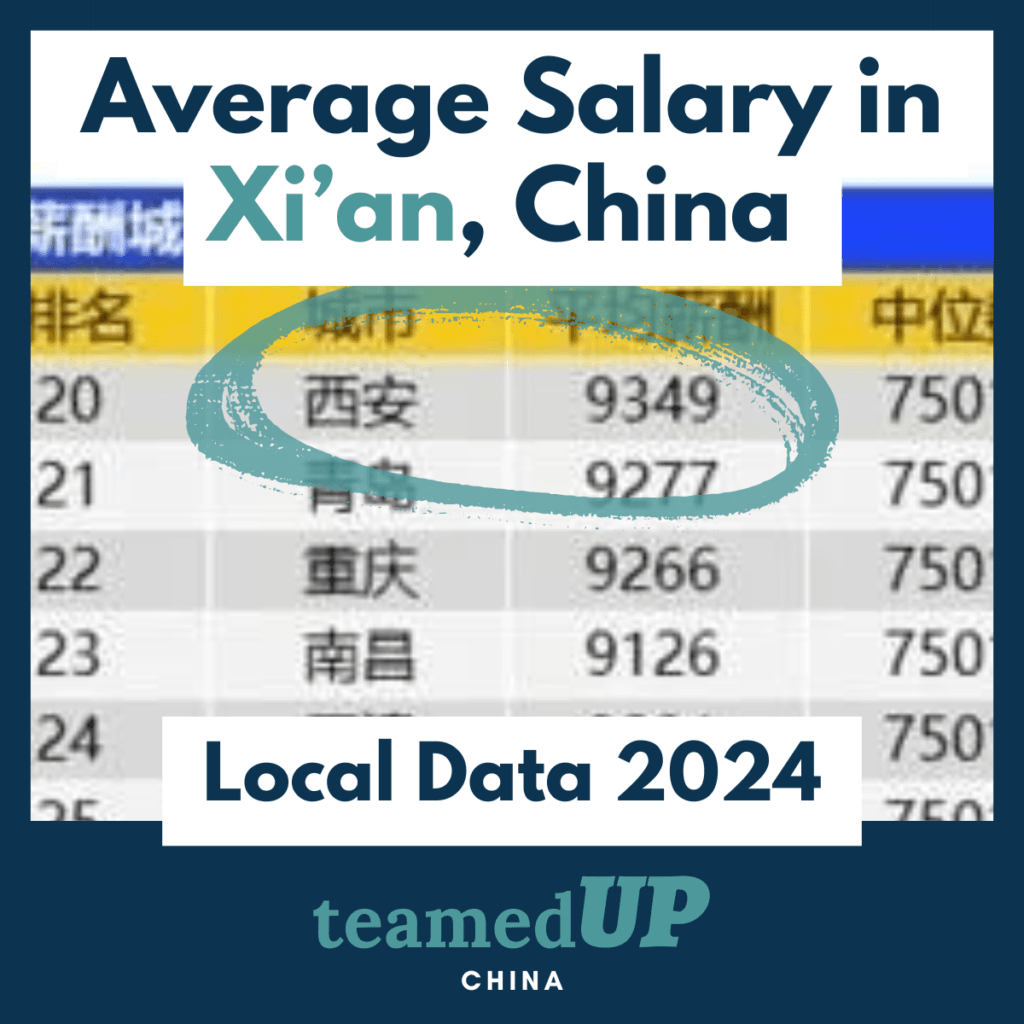
The eastern coastal city of Ningbo is one of the largest in China and a major economic hub. Today we’re breaking down multiple sources of public, local data to see what the average salary level really is in this megacity. So let’s get to it! A dive into some 2024 Ningbo salary data…   💡 Why not use data from international sources, you ask? When it comes to salary figures in China, we’ve found a big discrepancy in the data provided by most outlets. Hiring in China? We can help. Post open roles across China’s top job sites, classifieds, and networking platforms — lower hiring costs by over 80%. Edit Template Average Salary in Ningbo: Government Data Ningbo Statistics Bureau In June 2024, Ningbo’s Statistics Bureau[1] released its most recent data on salaries. The figures represent wage data collected throughout 2023. They specifically split up the data into private and non-private categories.  Non-Private Jobs Average annual income: ¥133,967 RMB ($18,928 USD) Average monthly income: ¥11,163 RMB ($1,577 USD)   Private Jobs Average annual income: ¥77,550 RMB ($10,957 USD) Average monthly income: ¥6,462 RMB ($913 USD) Data considerations The report also specifies what exactly the term ‘total wages‘ means here: Total wages refer to the total amount of labor remuneration directly paid to employees of the unit during the reporting period (quarter or year). It includes time wages, piece wages, bonuses, allowances and subsidies, overtime wages, and wages paid under special circumstances. The total wage is the pre-tax wage, including personal income tax, social insurance funds, housing provident fund and other personal contributions. On private vs non-private categories: Private legal entities specifically include: private limited liability companies, private joint stock companies, sole proprietorships and partnerships among domestic enterprises. Non-private legal entities in urban areas specifically include: domestic-funded (including government agencies and public institutions) units other than private units, Hong Kong, Macao and Taiwan-invested enterprises, and foreign-invested enterprises. The data collection method seems to be a self-reported survey, likely required for submission by legal entities (as this is a government bureau after all): A comprehensive survey method is adopted for legal entities that use one set of forms, and a sampling survey method is adopted for legal entities that do not use one set of forms. Average Salary in Ningbo: Local HR Data Ningbo Salary Data (Zhilian Zhaopin) Local HR giant Zhaopin regularly releases salary data for cities across China. The above photo shows the top 38 cities’ average and median salary levels in Q2 2024. Ningbo came in at the #8 spot with an average monthly salary of ¥10,722 RMB ($1,514 USD)/month. Ningbo’s median salary here is ¥9,001 RMB ($1,271 USD)/month.   Compared to Other Top Cities Shanghai took the first spot with an average monthly salary of ¥13,732 RMB ($1,933 USD)/month. Beijing ranked second with an average monthly salary of ¥13,351 RMB ($1,874 USD)/month. Shenzhen comes in at the #3 spot with an average monthly salary of ¥12,799 RMB ($1,796 USD)/month. Hangzhou, Nanjing, Guangzhou, Suzhou, and Ningbo round out the top 8. We also have median salary data here and can see the median of the top 3 cities – Shanghai, Beijing, and Shenzhen – all exceeded ¥10,000 RMB ($1,393 USD)/month. The median of the top 8 cities (including Ningbo) all exceeded ¥9,000 RMB ($1,271 USD)/month It’s also interesting to note that there is a 59% difference in the median salary between the first (Shanghai) and last (Harbin) cities on this list. Related Resources: Average Salary in Shenzhen China: Local Data Breakdowns (2024) Salary Data for 8 of China’s Leading Tech Companies (2024) Average Salary Ranges for New University Graduates in China Top 10 Highest Paying Cities in China (2024) Average Salary in China: Local Data 2023+2024 Hiring in China? We can help, and likely lower your hiring costs by over 80% We’ve been recruiting in China since 2014! Our China Candidate Sourcing Service helps companies post & promote open roles across top Chinese jobs & networking platforms. Let’s find your next great China-based team member together.  Book A Call Post a Job Contact us to discuss hiring goals, salary & compensation budgets, and if TeamedUp China is the right fit to support your organization. New here? Get 25% off your first job post with us. Edit Template

Average Salary in Ningbo China: Local Data Breakdowns (2024) Read More »
Average Salary in Xiamen China - TeamedUp China

Average Salary in Xiamen China: Local Data Breakdowns (2024)

The southeastern city of Xiamen is one of the largest in China and a major logistics and manufacturing hub. Today we’re breaking down multiple sources of public, local data to see what the average salary level really is in this megacity. So let’s get to it! A dive into some 2024 Xiamen salary data…   💡 Why not use data from international sources, you ask? When it comes to salary figures in China, we’ve found a big discrepancy in the data provided by most outlets. Hiring in China? We can help. Post open roles across China’s top job sites, classifieds, and networking platforms — lower hiring costs by over 80%. Edit Template Average Salary Xiamen: Government Data Xiamen Statistics Bureau In June 2024, Xiamen’s Statistics Bureau[1] released its most recent data on salaries. The figures represent wage data collected throughout 2023, and only represent non-private salaries.    Average annual salary: ¥123,081 RMB ($17,390 USD) Average monthly salary: ¥10,256 RMB ($1,449 USD) Year-on-year increase: 1.2% Data considerations The report also specifies what exactly the term ‘total wages‘ means here: Total wages refer to the total amount of labor remuneration directly paid to employees of the unit during the reporting period (quarter or year). It includes time wages, piece wages, bonuses, allowances and subsidies, overtime wages, and wages paid under special circumstances. The total wage is the pre-tax wage, including personal income tax, social insurance funds, housing provident fund and other personal contributions. On private vs non-private categories: Private legal entities specifically include: private limited liability companies, private joint stock companies, sole proprietorships and partnerships among domestic enterprises. Non-private legal entities in urban areas specifically include: domestic-funded (including government agencies and public institutions) units other than private units, Hong Kong, Macao and Taiwan-invested enterprises, and foreign-invested enterprises. The data collection method seems to be a self-reported survey, likely required for submission by legal entities (as this is a government bureau after all): A comprehensive survey method is adopted for legal entities that use one set of forms, and a sampling survey method is adopted for legal entities that do not use one set of forms. Average Salary in Xiamen: Local HR Data Xiamen Salary Data (Zhilian Zhaopin) Local HR giant Zhaopin regularly releases salary data for cities across China. The above photo shows the top 38 cities’ average and median salary levels in Q2 2024. Xiamen came in at the #10 spot with an average monthly salary of ¥10,495 RMB ($1,482 USD)/month. Xiamen’s median salary here is ¥8,751 RMB ($1,236 USD)/month.   Compared to Other Top Cities Shanghai took the first spot with an average monthly salary of ¥13,732 RMB ($1,933 USD)/month. Beijing ranked second with an average monthly salary of ¥13,351 RMB ($1,874 USD)/month. Shenzhen comes in at the #3 spot with an average monthly salary of ¥12,799 RMB ($1,796 USD)/month. Hangzhou, Nanjing, Guangzhou, Suzhou, and Ningbo round out the top 8. We also have median salary data here and can see the median of the top 3 cities – Shanghai, Beijing, and Shenzhen – all exceeded ¥10,000 RMB ($1,393 USD)/month. The median of the top 19 cities (including Xiamen) all exceeded ¥8,000 RMB ($1,130 USD)/month It’s also interesting to note that there is a 59% difference in the median salary between the first (Shanghai) and last (Harbin) cities on this list. Related Resources: Average Salary in Shenzhen China: Local Data Breakdowns (2024) Salary Data for 8 of China’s Leading Tech Companies (2024) Average Salary Ranges for New University Graduates in China Top 10 Highest Paying Cities in China (2024) Average Salary in China: Local Data 2023+2024 Hiring in China? We can help, and likely lower your hiring costs by over 80% We’ve been recruiting in China since 2014! Our China Candidate Sourcing Service helps companies post & promote open roles across top Chinese jobs & networking platforms. Let’s find your next great China-based team member together.  Book A Call Post a Job Contact us to discuss hiring goals, salary & compensation budgets, and if TeamedUp China is the right fit to support your organization. New here? Get 26% off your first job post with us. Edit Template

Average Salary in Xiamen China: Local Data Breakdowns (2024) Read More »
Average Salary in Foshan China - TeamedUp China

Average Salary in Foshan China: Local Data Breakdowns (2024)

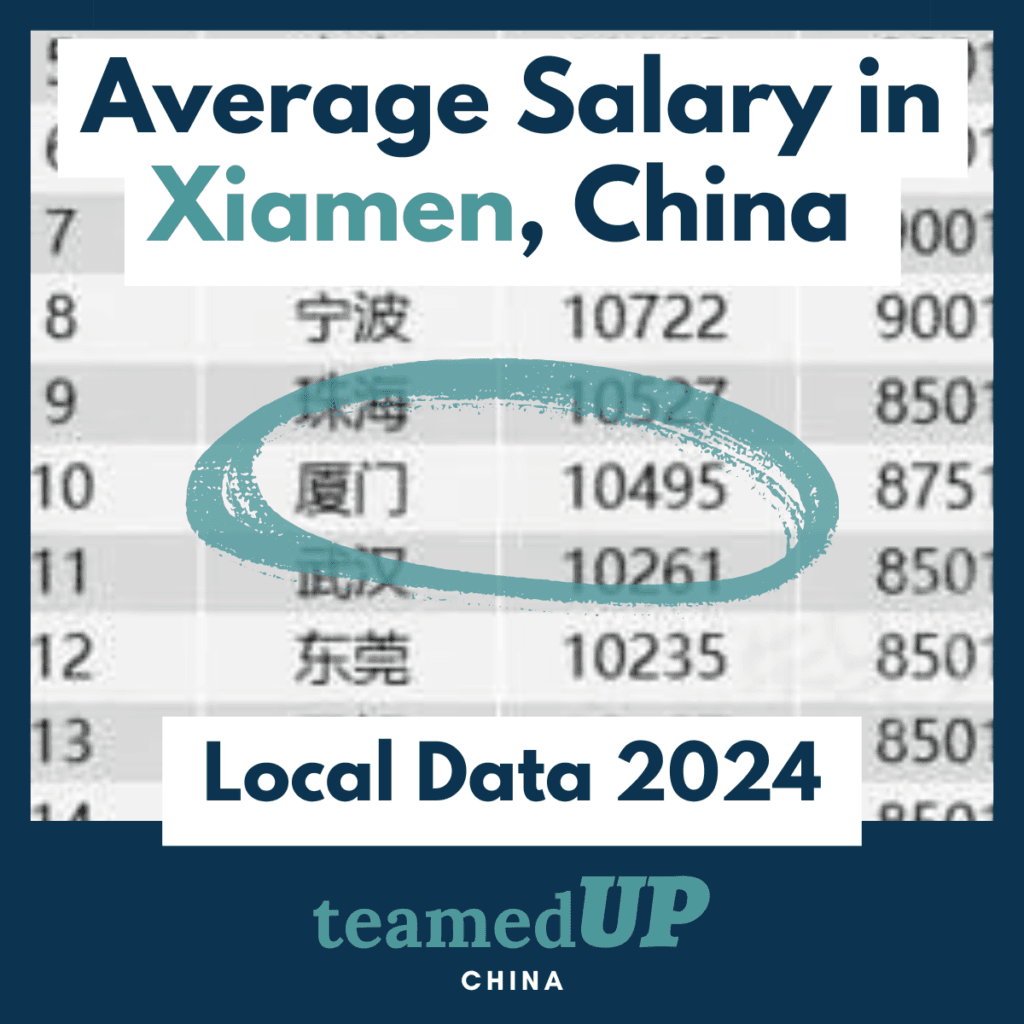
The southern city of Foshan is one of the largest in China and a major manufacturing and tech hub. Today we’re breaking down multiple sources of public, local data to see what the average salary level really is in this megacity. So let’s get to it! A dive into some 2024 Foshan salary data…   💡 Why not use data from international sources, you ask? When it comes to salary figures in China, we’ve found a big discrepancy in the data provided by most outlets. Hiring in China? We can help. Post open roles across China’s top job sites, classifieds, and networking platforms — lower hiring costs by over 80%. Edit Template Average Salary Foshan: Government Data Foshan Statistics Bureau In June 2024, Foshan’s Statistics Bureau[1] released its most recent data on salaries. The figures represent wage data collected throughout 2023.   Average annual salary: ¥114,384 RMB ($16,161 USD) Average monthly salary: ¥9,532 RMB ($1,346 USD) Year-on-year increase: 5.3% Data considerations The report defines total wages: Total wages refer to the total amount of labor remuneration directly paid to employees of the unit during the reporting period (quarter or year). It includes time wages, piece wages, bonuses, allowances and subsidies, overtime wages, and wages paid under special circumstances. The total wage is the pre-tax wage, including personal income tax, social insurance funds, housing provident fund and other personal contributions. and which companies, or ‘urban units’, are included here: Urban units: refers to legal entities with 5 or more employees in urban areas, excluding individual businesses and self-employed professionals. Average Salary in Foshan: Local HR Data Foshan Salary Data (Zhilian Zhaopin) Local HR giant Zhaopin regularly releases salary data for cities across China. The above photo shows the top 38 cities’ average and median salary levels in Q2 2024. Foshan came in at the #15 spot with an average monthly salary of ¥10,077 RMB ($1,423 USD)/month. Foshan’s median salary here is ¥8,001 RMB ($1,130 USD)/month.   Compared to Other Top Cities Shanghai took the first spot with an average monthly salary of ¥13,732 RMB ($1,933 USD)/month. Beijing ranked second with an average monthly salary of ¥13,351 RMB ($1,874 USD)/month. Shenzhen comes in at the #3 spot with an average monthly salary of ¥12,799 RMB ($1,796 USD)/month. Hangzhou, Nanjing, Guangzhou, Suzhou, and Ningbo round out the top 8. We also have median salary data here and can see the median of the top 3 cities – Shanghai, Beijing, and Shenzhen – all exceeded ¥10,000 RMB ($1,393 USD)/month. The median of the top 19 cities (including Foshan) all exceeded ¥8,000 RMB ($1,130 USD)/month It’s also interesting to note that there is a 59% difference in the median salary between the first (Shanghai) and last (Harbin) cities on this list. Related Resources: Average Salary in Shenzhen China: Local Data Breakdowns (2024) Salary Data for 8 of China’s Leading Tech Companies (2024) Average Salary Ranges for New University Graduates in China Top 10 Highest Paying Cities in China (2024) Average Salary in China: Local Data 2023+2024 Hiring in China? We can help, and likely lower your hiring costs by over 80% We’ve been recruiting in China since 2014! Our China Candidate Sourcing Service helps companies post & promote open roles across top Chinese jobs & networking platforms. Let’s find your next great China-based team member together.  Book A Call Post a Job Contact us to discuss hiring goals, salary & compensation budgets, and if TeamedUp China is the right fit to support your organization. New here? Get 26% off your first job post with us. Edit Template

Average Salary in Foshan China: Local Data Breakdowns (2024) Read More »
Average Salary in Dongguan China - TeamedUp China

Average Salary in Dongguan China: Local Data Breakdowns (2024)

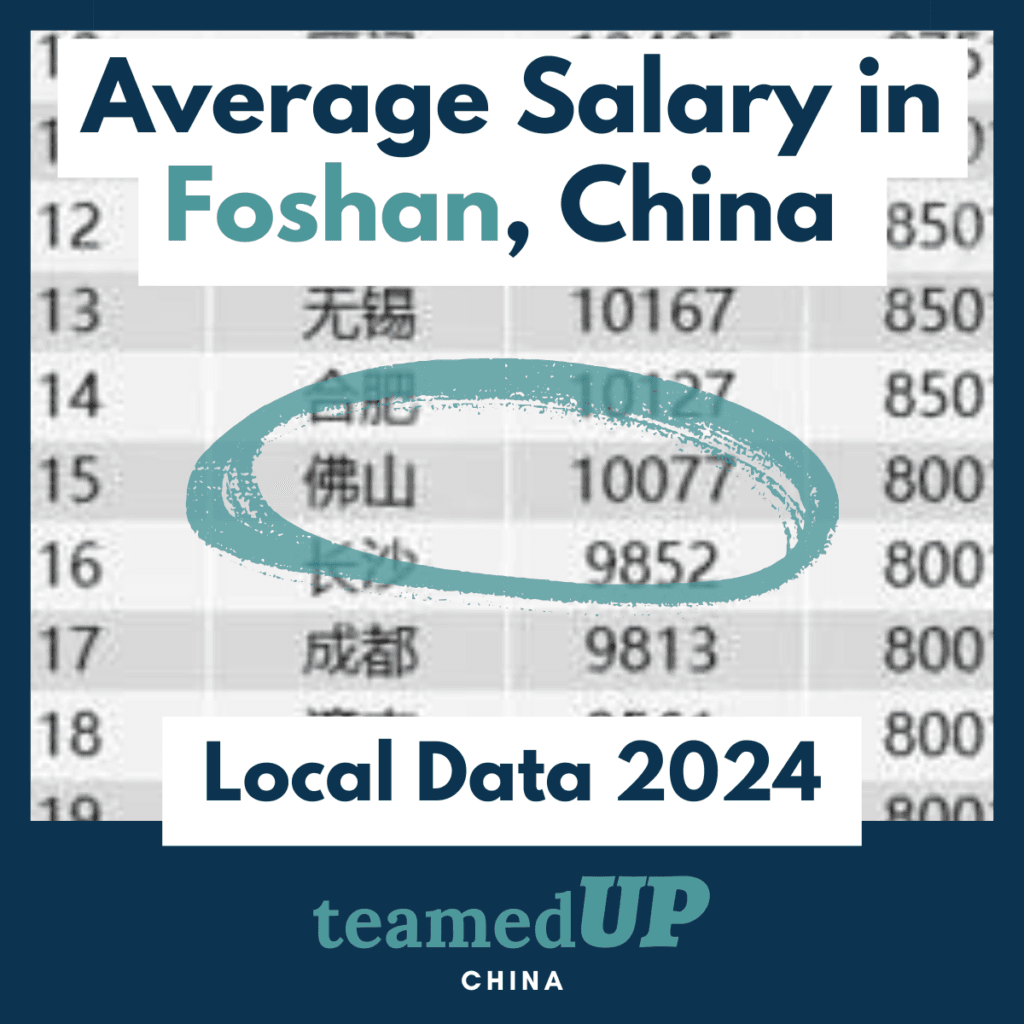
The southern city of Dongguan is one of the largest in China and a major manufacturing and tech hub. Today we’re breaking down multiple sources of public, local data to see what the average salary level really is in this megacity. So let’s get to it! A dive into some 2024 Dongguan salary data…   💡 Why not use data from international sources, you ask? When it comes to salary figures in China, we’ve found a big discrepancy in the data provided by most outlets. Hiring in China? We can help. Post open roles across China’s top job sites, classifieds, and networking platforms — lower hiring costs by over 80%. Edit Template Average Salary in Dongguan: Government Data Guangdong Provincial Bureau of Statistics In June 2024, Dongguan’s Statistics Bureau[1] released its most recent data on salaries. The figures represent wage data collected throughout 2023. They specifically split up the data into private and non-private categories.  Non-Private Jobs Average annual income: ¥98,172 RMB ($13,870 USD) Average monthly income: ¥8,181 RMB ($1,155 USD)   Private Jobs Average annual income: ¥80,574 RMB ($11,384 USD) Average monthly income: ¥6,714 RMB ($948 USD) Data considerations The report also specifies what exactly the term ‘total wages‘ means here: Total wages refer to the total amount of labor remuneration directly paid to employees of the unit during the reporting period (quarter or year). It includes time wages, piece wages, bonuses, allowances and subsidies, overtime wages, and wages paid under special circumstances. The total wage is the pre-tax wage, including personal income tax, social insurance funds, housing provident fund and other personal contributions. On private vs non-private categories: Private legal entities specifically include: private limited liability companies, private joint stock companies, sole proprietorships and partnerships among domestic enterprises. Non-private legal entities in urban areas specifically include: domestic-funded (including government agencies and public institutions) units other than private units, Hong Kong, Macao and Taiwan-invested enterprises, and foreign-invested enterprises. The data collection method seems to be a self-reported survey, likely required for submission by legal entities (as this is a government bureau after all): A comprehensive survey method is adopted for legal entities that use one set of forms, and a sampling survey method is adopted for legal entities that do not use one set of forms. Average Salary in Dongguan: Local HR Data Dongguan Salary Data (Zhilian Zhaopin) Local HR giant Zhaopin regularly releases salary data for cities across China. The above photo shows the top 38 cities’ average and median salary levels in Q2 2024. Dongguan came in at the #12 spot with an average monthly salary of ¥10,235 RMB ($1,446 USD)/month. Dongguan’s median salary here is ¥8,501 RMB ($1,208 USD)/month.   Compared to Other Top Cities Shanghai took the first spot with an average monthly salary of ¥13,732 RMB ($1,933 USD)/month. Beijing ranked second with an average monthly salary of ¥13,351 RMB ($1,874 USD)/month. Shenzhen comes in at the #3 spot with an average monthly salary of ¥12,799 RMB ($1,796 USD)/month. Hangzhou, Nanjing, Guangzhou, Suzhou, and Ningbo round out the top 8. We also have median salary data here and can see the median of the top 3 cities – Shanghai, Beijing, and Shenzhen – all exceeded ¥10,000 RMB ($1,393 USD)/month. The median of the top 19 cities (including Dongguan) all exceeded ¥8,000 RMB ($1,137 USD)/month It’s also interesting to note that there is a 59% difference in the median salary between the first (Shanghai) and last (Harbin) cities on this list. Related Resources: Average Salary in Shenzhen China: Local Data Breakdowns (2024) Salary Data for 8 of China’s Leading Tech Companies (2024) Average Salary Ranges for New University Graduates in China Top 10 Highest Paying Cities in China (2024) Average Salary in China: Local Data 2023+2024 Hiring in China? We can help, and likely lower your hiring costs by over 80% We’ve been recruiting in China since 2014! Our China Candidate Sourcing Service helps companies post & promote open roles across top Chinese jobs & networking platforms. Let’s find your next great China-based team member together.  Book A Call Post a Job Contact us to discuss hiring goals, salary & compensation budgets, and if TeamedUp China is the right fit to support your organization. New here? Get 26% off your first job post with us. Edit Template

Average Salary in Dongguan China: Local Data Breakdowns (2024) Read More »
Average Salary in Wuhan China - TeamedUp China

Average Salary in Wuhan China: Local Data Breakdowns (2024)

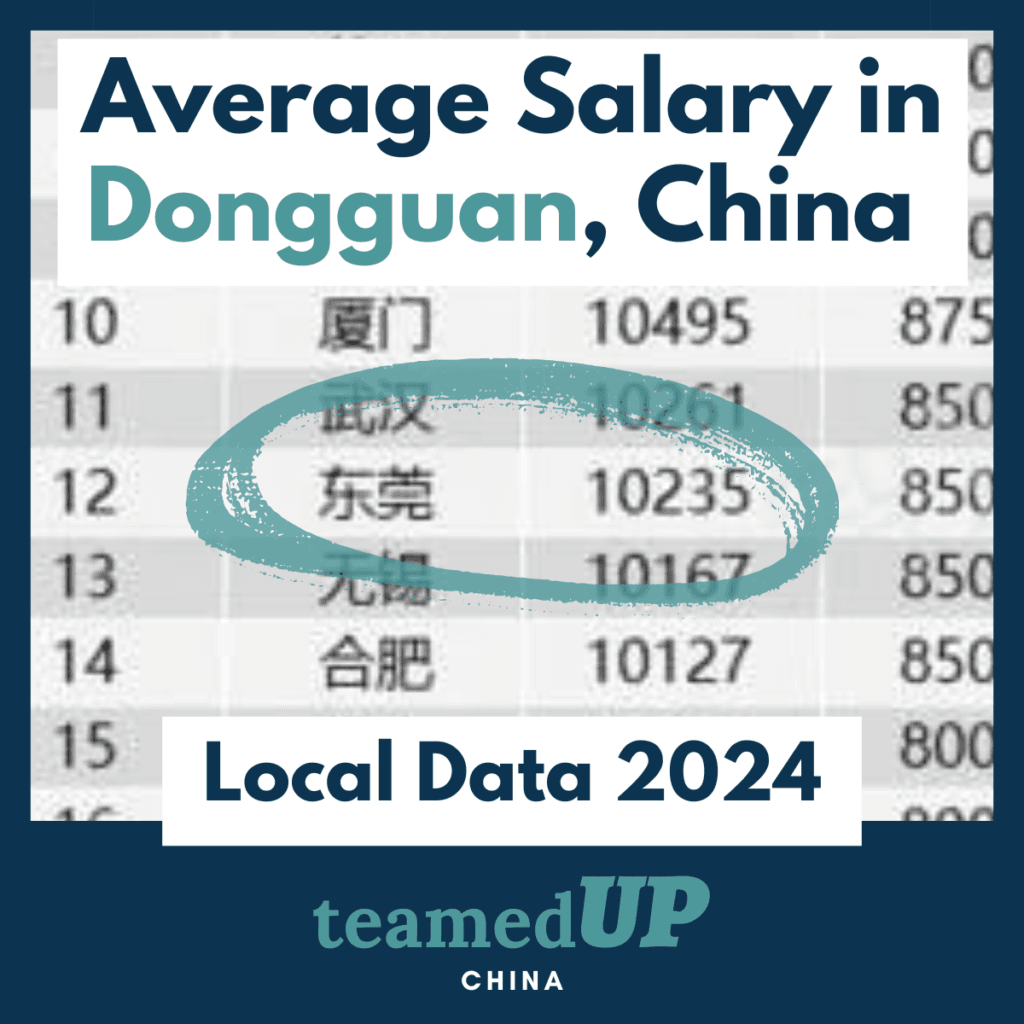
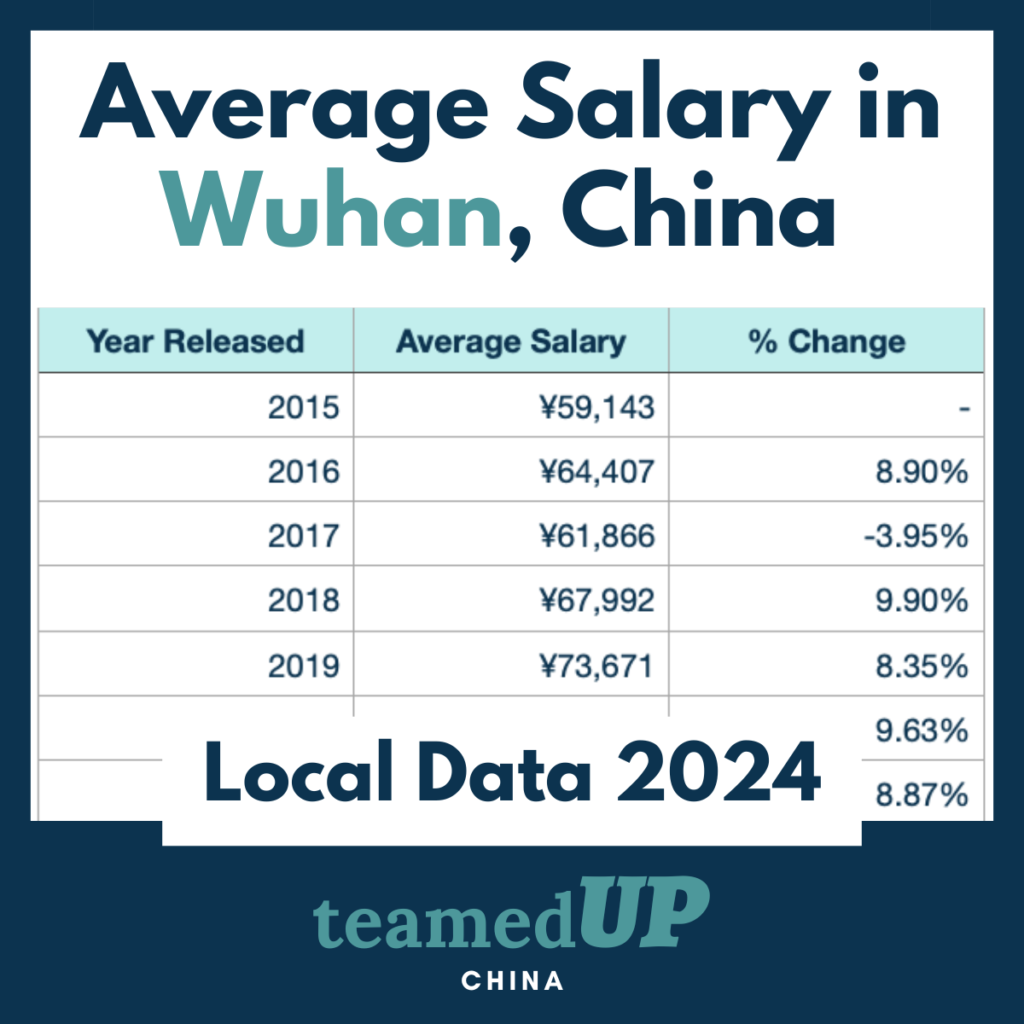
The city of Wuhan is one of the largest in China and a major economic, transportation, and research hub. Today we’re breaking down multiple sources of public, local data to see what the average salary level really is in this megacity. So let’s get to it! A dive into some 2024 Wuhan salary data…   💡 Why not use data from international sources, you ask? When it comes to salary figures in China, we’ve found a big discrepancy in the data provided by most outlets. Hiring in China? We can help. Post open roles across China’s top job sites, classifieds, and networking platforms — lower hiring costs by over 80%. Edit Template Average Salary in Wuhan: Government Data Wuhan Statistics Bureau In June 2024, Wuhan’s Statistics Bureau[2] released its most recent data on salaries. The figures represent wage data collected throughout 2023. Average annual salary: ¥110,134 RMB ($15,660 USD) Average monthly salary: ¥9,178 RMB ($1,305 USD) Data considerations The report defines total wages: Total wages refer to the total amount of labor remuneration directly paid to employees of the unit during the reporting period (quarter or year). It includes time wages, piece wages, bonuses, allowances and subsidies, overtime wages, and wages paid under special circumstances. The total wage is the pre-tax wage, including personal income tax, social insurance funds, housing provident fund and other personal contributions. and which companies, or ‘urban units’, are included here: Urban units: refers to legal entities with 5 or more employees in urban areas, excluding individual businesses and self-employed professionals. Wuhan’s Historic Salary Growth In the 2023 bureau report (reflecting 2022 wages), the average annual salary in the public category was listed as ¥103,308 RMB ($14,689 USD), marking an annual increase of 6.61%.  If we look further back into the bureau’s reports, the average wage in Nanjing has risen nearly 90% since the 2015 report: Average Salary in Wuhan: Local HR Data Wuhan Salary Data (Zhilian Zhaopin) Local HR giant Zhaopin regularly releases salary data for cities across China. The above photo shows the top 38 cities’ average and median salary levels in Q2 2024. Wuhan came in at the #11 spot with an average monthly salary of ¥10,261 RMB ($1,459 USD)/month. Wuhan’s median salary here is ¥8,501 RMB ($1,208 USD)/month.   Compared to Other Top Cities Shanghai took the first spot with an average monthly salary of ¥13,732 RMB ($1,933 USD)/month. Beijing ranked second with an average monthly salary of ¥13,351 RMB ($1,874 USD)/month. Shenzhen comes in at the #3 spot with an average monthly salary of ¥12,799 RMB ($1,796 USD)/month. Hangzhou, Nanjing, Guangzhou, Suzhou, and Ningbo round out the top 8. We also have median salary data here and can see the median of the top 3 cities – Shanghai, Beijing, and Shenzhen – all exceeded ¥10,000 RMB ($1,393 USD)/month. The median of the top 19 cities (including Wuhan) all exceeded ¥8,000 RMB ($1,137 USD)/month It’s also interesting to note that there is a 59% difference in the median salary between the first (Shanghai) and last (Harbin) cities on this list. Related Resources: Average Salary in Shanghai China: Local Data Breakdowns (2024) Salary Data for 8 of China’s Leading Tech Companies (2024) Average Salary Ranges for New University Graduates in China Top 10 Highest Paying Cities in China (2024) Average Salary in China: Local Data 2023+2024 Hiring in China? We can help, and likely lower your hiring costs by over 80% We’ve been recruiting in China since 2014! Our China Candidate Sourcing Service helps companies post & promote open roles across top Chinese jobs & networking platforms. Let’s find your next great China-based team member together.  Book A Call Post a Job Contact us to discuss hiring goals, salary & compensation budgets, and if TeamedUp China is the right fit to support your organization. New here? Get 26% off your first job post with us. Edit Template

Average Salary in Wuhan China: Local Data Breakdowns (2024) Read More »
Average Salary in Nanjing China - TeamedUp China

Average Salary in Nanjing China: Local Data Breakdowns (2024)

The ancient capital of Nanjing is one of the largest cities in China and one of the country’s top 10 highest-paying. It is also one of the key hubs of the Yangtze River Delta, along with other giants like Shanghai, Nanjing, Hangzhou, Suzhou, Ningbo, and Wuxi. Today we’re breaking down multiple sources of public, local data to see what the average salary level really is in this megacity. So let’s get to it! A dive into some 2024 Nanjing salary data…   💡 Why not use data from international sources, you ask? When it comes to salary figures in China, we’ve found a big discrepancy in the data provided by most outlets. Hiring in China? We can help. Post open roles across China’s top job sites, classifieds, and networking platforms — lower hiring costs by over 80%. Edit Template Average Salary in Nanjing: Government Data Nanjing Statistics Bureau In July 2024, Nanjing’s Statistics Bureau[2] released its most recent data on salaries. The figures represent wage data collected throughout 2023. They specifically split up the data into private and non-private categories.  Non-Private Jobs Average annual income: ¥154,206 RMB ($21,870 USD) Average monthly income: ¥12,851 RMB ($1,822 USD)   Private Jobs Average annual income: ¥82,311 RMB ($11,674 USD) Average monthly income: ¥6,859 RMB ($972 USD) Data considerations The report also specifies what exactly the term ‘total wages‘ means here: Total wages refer to the total amount of labor remuneration directly paid to employees of the unit during the reporting period (quarter or year). It includes time wages, piece wages, bonuses, allowances and subsidies, overtime wages, and wages paid under special circumstances. The total wage is the pre-tax wage, including personal income tax, social insurance funds, housing provident fund and other personal contributions. On private vs non-private categories: Private legal entities specifically include: private limited liability companies, private joint stock companies, sole proprietorships and partnerships among domestic enterprises. Non-private legal entities in urban areas specifically include: domestic-funded (including government agencies and public institutions) units other than private units, Hong Kong, Macao and Taiwan-invested enterprises, and foreign-invested enterprises. The data collection method seems to be a self-reported survey, likely required for submission by legal entities (as this is a government bureau after all): A comprehensive survey method is adopted for legal entities that use one set of forms, and a sampling survey method is adopted for legal entities that do not use one set of forms. Nanjing’s Historic Salary Growth In the 2023 bureau report (reflecting 2022 wages), the average annual salary in the public category was listed as ¥149,214 RMB ($21,162 USD), an increase of 3.35% from the previous year.  If we look further back into the bureau’s reports, the average wage in Nanjing has risen nearly 140% since the 2014 report: Average Salary in Nanjing: Local HR Data Nanjing Salary Data (Zhilian Zhaopin) Local HR giant Zhaopin regularly releases salary data for cities across China. The above photo shows the top 38 cities’ average and median salary levels in Q2 2024. Nanjing came in at the #5 spot with an average monthly salary of ¥11,142 RMB ($1,580 USD)/month. Nanjing’s median salary here is ¥9,001 RMB ($1,276 USD)/month.   Compared to Other Top Cities Shanghai took the first spot with an average monthly salary of ¥13,732 RMB ($1,933 USD)/month. Beijing ranked second with an average monthly salary of ¥13,351 RMB ($1,874 USD)/month. Shenzhen comes in at the #3 spot with an average monthly salary of ¥12,799 RMB ($1,796 USD)/month. Hangzhou, Nanjing, Guangzhou, Suzhou, and Ningbo round out the top 8.   We also have median salary data here and can see the median of the top 3 cities – Shanghai, Beijing, and Shenzhen – all exceeded ¥10,000 RMB ($1,393 USD)/month. The median of the top 8 cities (including Nanjing) all exceeded ¥9,000 RMB ($1,267 USD)/month It’s also interesting to note that there is a 59% difference in the median salary between the first (Shanghai) and last (Harbin) cities on this list. Related Resources: Average Salary in Suzhou China: Local Data Breakdowns (2024) Salary Data for 8 of China’s Leading Tech Companies (2024) Average Salary Ranges for New University Graduates in China Top 10 Highest Paying Cities in China (2024) Average Salary in China: Local Data 2023+2024 Hiring in China? We can help, and likely lower your hiring costs by over 80% We’ve been recruiting in China since 2014! Our China Candidate Sourcing Service helps companies post & promote open roles across top Chinese jobs & networking platforms. Let’s find your next great China-based team member together.  Book A Call Post a Job Contact us to discuss hiring goals, salary & compensation budgets, and if TeamedUp China is the right fit to support your organization. New here? Get 26% off your first job post with us. Edit Template

Average Salary in Nanjing China: Local Data Breakdowns (2024) Read More »
Average Salary in Chongqing China - TeamedUp China

Average Salary in Chongqing China: Local Data Breakdowns (2024)

The city of Chongqing is one of the (or the[1]) largest in China. Today we’re breaking down multiple sources of public, local data to see what the average salary level really is in this megacity.  So let’s get to it! A dive into some 2024 Chongqing salary data…   💡 Why not use data from international sources, you ask? When it comes to salary figures in China, we’ve found a big discrepancy in the data provided by most outlets. Hiring in China? We can help. Post open roles across China’s top job sites, classifieds, and networking platforms — lower hiring costs by over 80%. Edit Template Average Salary in Chongqing: Government Data Chongqing Statistics Bureau In June 2024, Chongqing’s Statistics Bureau[2] released its most recent data on salaries. The figures represent wage data collected throughout 2023. They specifically split up the data into private and non-private categories.  Non-Private Jobs Average annual income: ¥113,653 RMB ($16,112 USD) Average monthly income: ¥9,471 RMB ($1,342 USD) Annual Increase: 6.2%   Private Jobs Average annual income: ¥63,941 RMB ($9,064 USD) Average monthly income: ¥5,328 RMB ($755 USD) Annual Increase: 5.9%   Personnel Categories The Bureau further dove into average salaries in the city with ‘personnel’ categories. Here is the annual average wage for each of these- Middle-level and above managers: ¥169,106 RMB ($23,974 USD) Professional and technical personnel: ¥115,723 RMB ($16,405 USD) Office and related personnel: ¥75,372 RMB ($10,685 USD) Social production and life service personnel: ¥62,067 RMB ($8,799 USD) Production and manufacturing and related personnel: ¥69,709 RMB ($9,882 USD)   Just a note that only ‘Enterprises above a designated size’ were used for these categories.  Data considerations The report also specifies what exactly the term ‘total wages‘ means here: Total wages refer to the total amount of labor remuneration directly paid to employees of the unit during the reporting period (quarter or year). It includes time wages, piece wages, bonuses, allowances and subsidies, overtime wages, and wages paid under special circumstances. The total wage is the pre-tax wage, including personal income tax, social insurance funds, housing provident fund and other personal contributions. On private vs non-private categories: Private legal entities specifically include: private limited liability companies, private joint stock companies, sole proprietorships and partnerships among domestic enterprises. Non-private legal entities in urban areas specifically include: domestic-funded (including government agencies and public institutions) units other than private units, Hong Kong, Macao and Taiwan-invested enterprises, and foreign-invested enterprises. The data collection method described in the report does leave this writer wanting a bit more clarification (a trend among city statistics bureaus). It seems to be a self-reported survey, likely required for submission by legal entities (as this is a government bureau after all). Here it is from the report: A comprehensive survey method is adopted for legal entities that use one set of forms, and a sampling survey method is adopted for legal entities that do not use one set of forms. Average Salary in Chongqing: Local HR Data Chongqing Salary Data (Zhilian Zhaopin) Local HR giant Zhaopin regularly releases salary data for cities across China. The above photo shows the top 38 cities’ average and median salary levels in Q2 2024. Chongqing came in at the #22 spot with an average monthly salary of ¥9,266 RMB ($1,313 USD)/month. Chongqing’s median salary here is ¥7,501 RMB ($1,127 USD)/month.   Compared to Other Top Cities Shanghai took the first spot with an average monthly salary of ¥13,732 RMB ($1,933 USD)/month. Beijing ranked second with an average monthly salary of ¥13,351 RMB ($1,874 USD)/month. Shenzhen comes in at the #3 spot with an average monthly salary of ¥12,799 RMB ($1,796 USD)/month. Hangzhou, Nanjing, Guangzhou, Suzhou, and Ningbo round out the top 8. Chongqing has a similar salary level to Qingdao (#21) and Tianjin (#24).   We also have median salary data here and can see the median of the top 3 cities – Shanghai, Beijing, and Shenzhen – all exceeded ¥10,000 RMB ($1,393 USD)/month. The median of the top 8 cities all exceeded ¥9,000 RMB ($1,267 USD)/month The median of the top 28 cities (including Chongqing) all exceeded ¥7,500 RMB ($1,057 USD)/month It’s also interesting to note that there is a 59% difference in the median salary between the first (Shanghai) and last (Harbin) cities on this list. Related Resources: Average Salary in Chengdu China: Local Data Breakdowns (2024) Salary Data for 8 of China’s Leading Tech Companies (2024) Average Salary Ranges for New University Graduates in China Top 10 Highest Paying Cities in China (2024) Average Salary in China: Local Data 2023+2024 Hiring in China? We can help, and likely lower your hiring costs by over 80% We’ve been recruiting in China since 2014! Our China Candidate Sourcing Service helps companies post & promote open roles across top Chinese jobs & networking platforms. Let’s find your next great China-based team member together.  Book A Call Post a Job Contact us to discuss hiring goals, salary & compensation budgets, and if TeamedUp China is the right fit to support your organization. New here? Get 26% off your first job post with us. Edit Template

Average Salary in Chongqing China: Local Data Breakdowns (2024) Read More »
Average Salary in Tianjin China - TeamedUp China

Average Salary in Tianjin China: Local Data Breakdowns (2024)

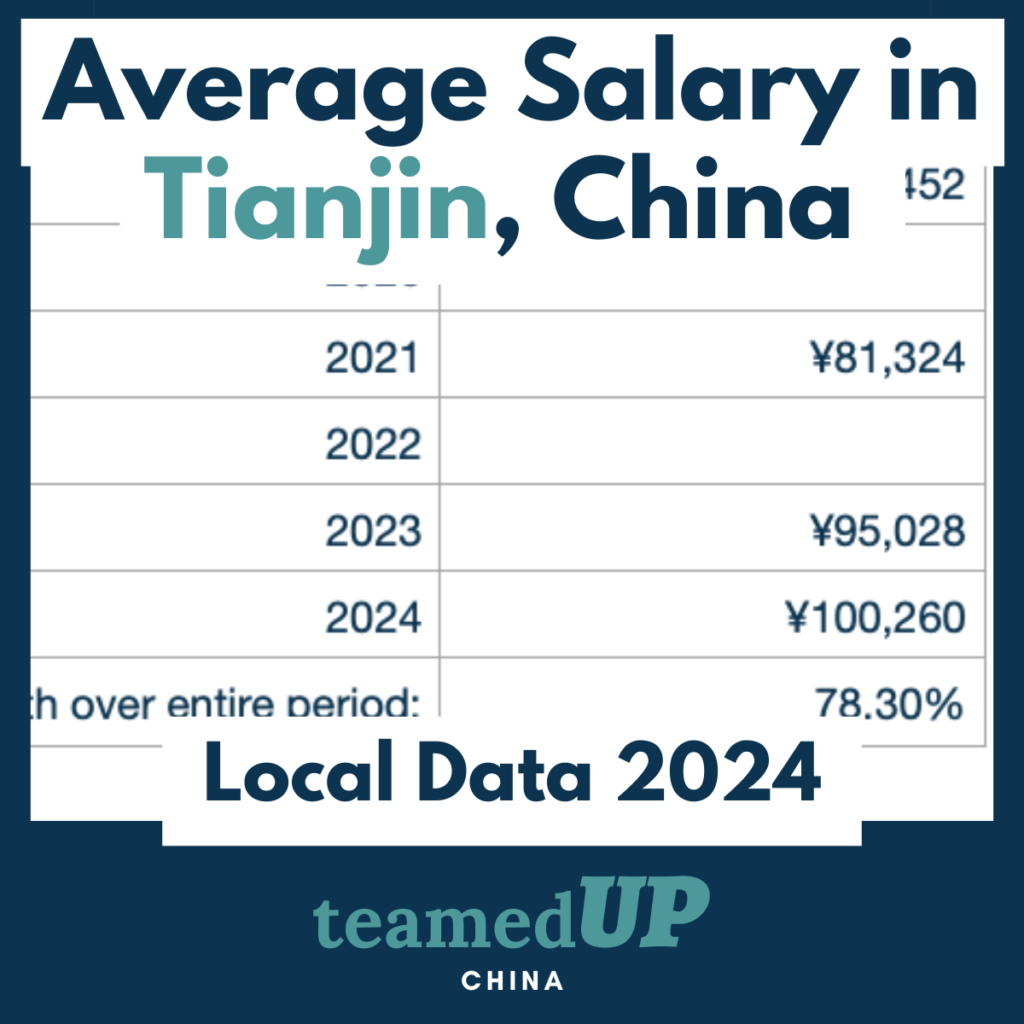
The city of Tianjin is one of the largest in China, with over 14 million people calling it their home.[1] Today we’re breaking down multiple sources of public, local data to see what the average salary level really is in this megacity.  So let’s get to it! A dive into some 2024 Tianjin salary data…   💡 Why not use data from international sources, you ask? When it comes to salary figures in China, we’ve found a big discrepancy in the data provided by most outlets. Hiring in China? We can help. Post open roles across China’s top job sites, classifieds, and networking platforms — lower hiring costs by over 80%. Edit Template Average Salary in Tianjin: Government Data Tianjin Municipal Government In July 2024, Tianjin’s Municipal People’s Government[2] released its most recent data on salaries. The figures represent wage data collected throughout 2023.   Average annual income: ¥100,260 RMB ($14,134 USD) Average monthly income: ¥8,355 RMB ($1,177 USD) Data considerations The report also specifies what exactly the term ‘total wages‘ means here: Total wages: It includes time wages, piece wages, bonuses, allowances and subsidies, overtime wages, wages paid under special circumstances, and is the sum of the total wages of on-the-job employees, the total wages of dispatched employees, and the total wages of other employees The data collection method described in the report does leave this writer wanting a bit more clarification (a trend among city statistics bureaus). It seems to be a self-reported survey, likely required for submission by legal entities (as this is a government bureau after all). Here it is from the report: A comprehensive survey method is adopted for legal entities that use one set of forms, and a sampling survey method is adopted for legal entities that do not use one set of forms. Tianjin’s Historic Salary Growth In the 2023 bureau report (reflecting 2022 wages), the average annual salary in the public category was listed as ¥95,028 RMB ($13,396 USD), an increase of 5.5% from the previous year.  If we look further back into the bureau’s reports, the average wage in Tianjin has risen nearly 80% since the 2015 report: Average Salary in Tianjin: Local HR Data Tianjin Salary Data (Zhilian Zhaopin) Local HR giant Zhaopin regularly releases salary data for cities across China. The above photo shows the top 38 cities’ average and median salary levels in Q2 2024. Tianjin came in at the #24 spot with an average monthly salary of ¥9,031 RMB ($1,273 USD)/month. Tianjin’s median salary here is ¥7,501 RMB ($1,127 USD)/month.   Compared to Other Top Cities Shanghai took the first spot with an average monthly salary of ¥13,732 RMB ($1,933 USD)/month. Beijing ranked second with an average monthly salary of ¥13,351 RMB ($1,874 USD)/month. Shenzhen comes in at the #3 spot with an average monthly salary of ¥12,799 RMB ($1,796 USD)/month. Hangzhou, Nanjing, Suzhou, and Ningbo round out the top 8. We also have median salary data here and can see the median of the top 3 cities – Shanghai, Beijing, and Shenzhen – all exceeded ¥10,000 RMB ($1,393 USD)/month. The median of the top 8 cities all exceeded ¥9,000 RMB ($1,267 USD)/month The median of the top 28 cities (including Tianjin) all exceeded ¥7,500 RMB ($1,057 USD)/month It’s also interesting to note that there is a 59% difference in the median salary between the first (Shanghai) and last (Harbin) cities on this list. Related Resources: Average Salary in Shenzhen China: Local Data Breakdowns (2024) Salary Data for 8 of China’s Leading Tech Companies (2024) Average Salary Ranges for New University Graduates in China Top 10 Highest Paying Cities in China (2024) Average Salary in China: Local Data 2023+2024 Hiring in China? We can help, and likely lower your hiring costs by over 80% We’ve been recruiting in China since 2014! Our China Candidate Sourcing Service helps companies post & promote open roles across top Chinese jobs & networking platforms. Let’s find your next great China-based team member together.  Book A Call Post a Job Contact us to discuss hiring goals, salary & compensation budgets, and if TeamedUp China is the right fit to support your organization. New here? Get 26% off your first job post with us. Edit Template

Average Salary in Tianjin China: Local Data Breakdowns (2024) Read More »