September 2024

Average Salary in Wuhan China - TeamedUp China

Average Salary in Wuhan China: Local Data Breakdowns (2024)

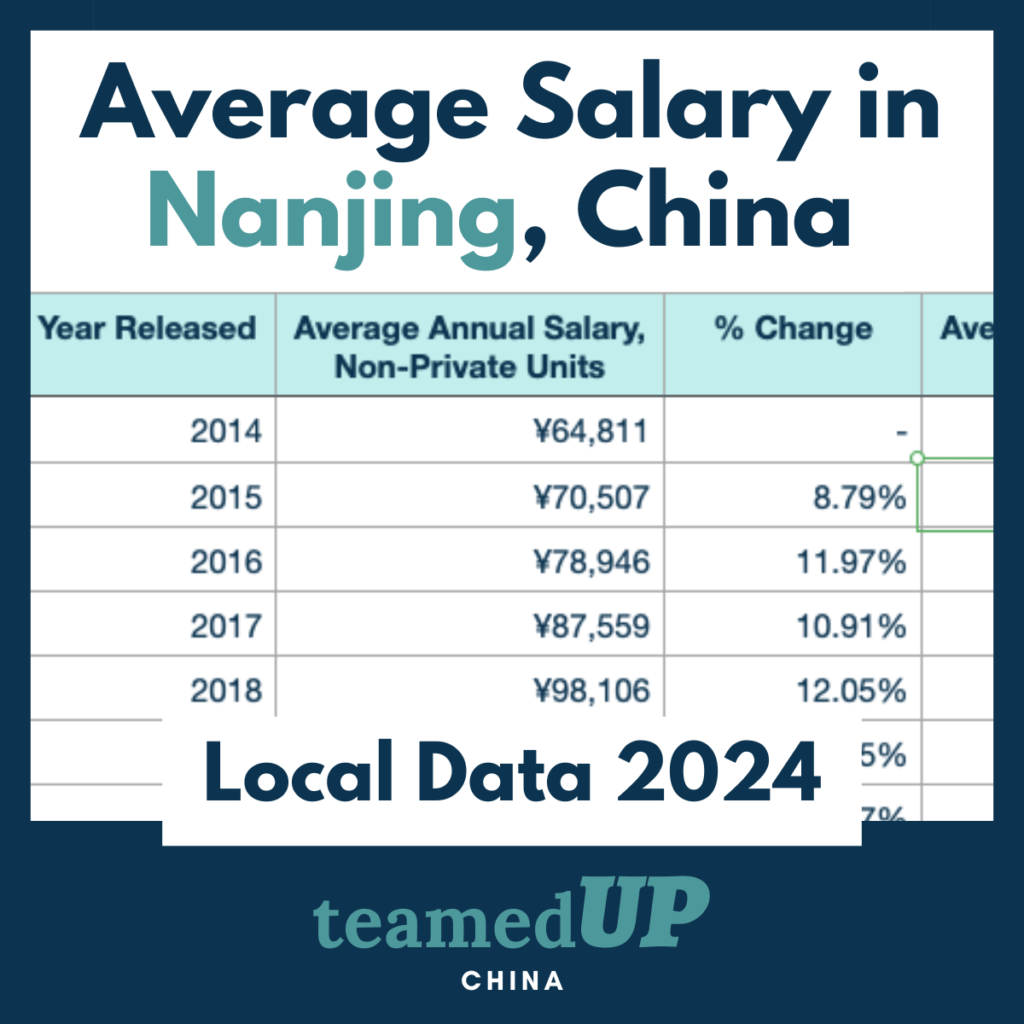
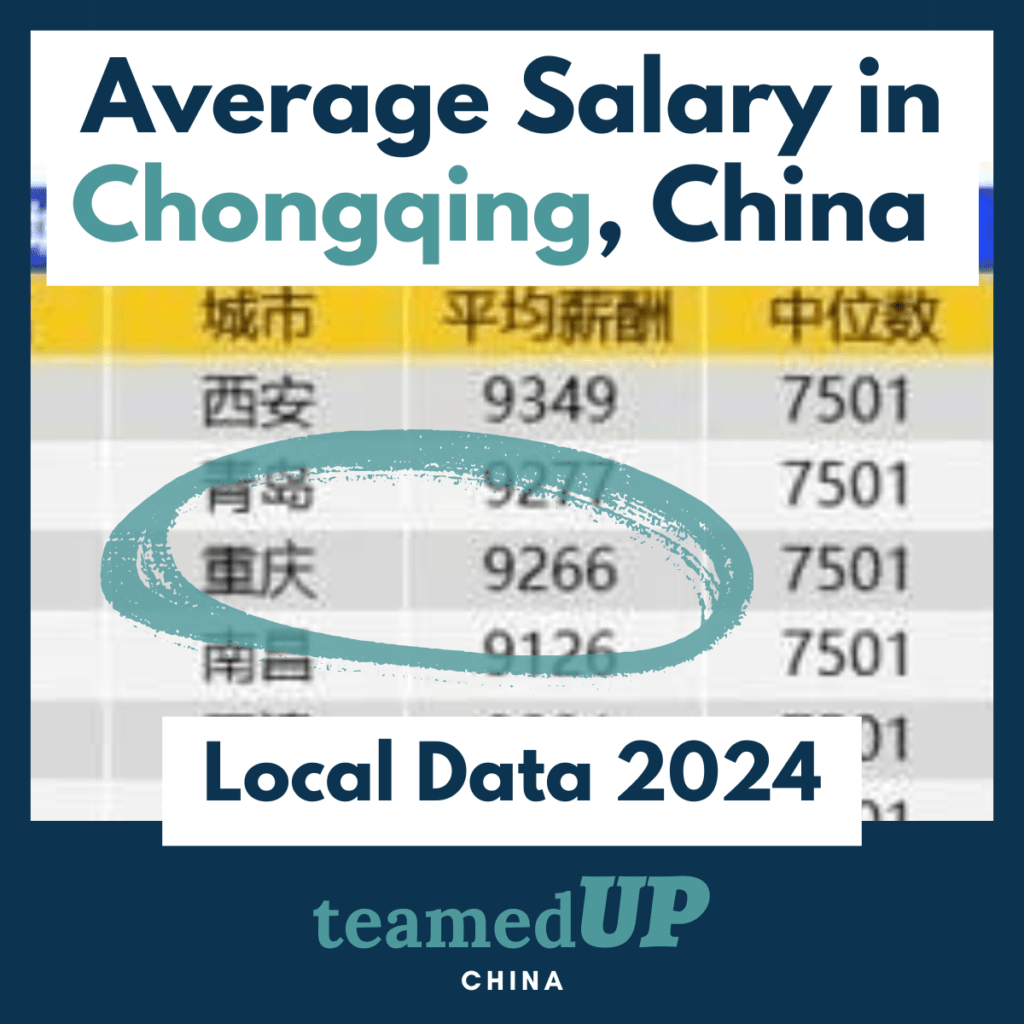
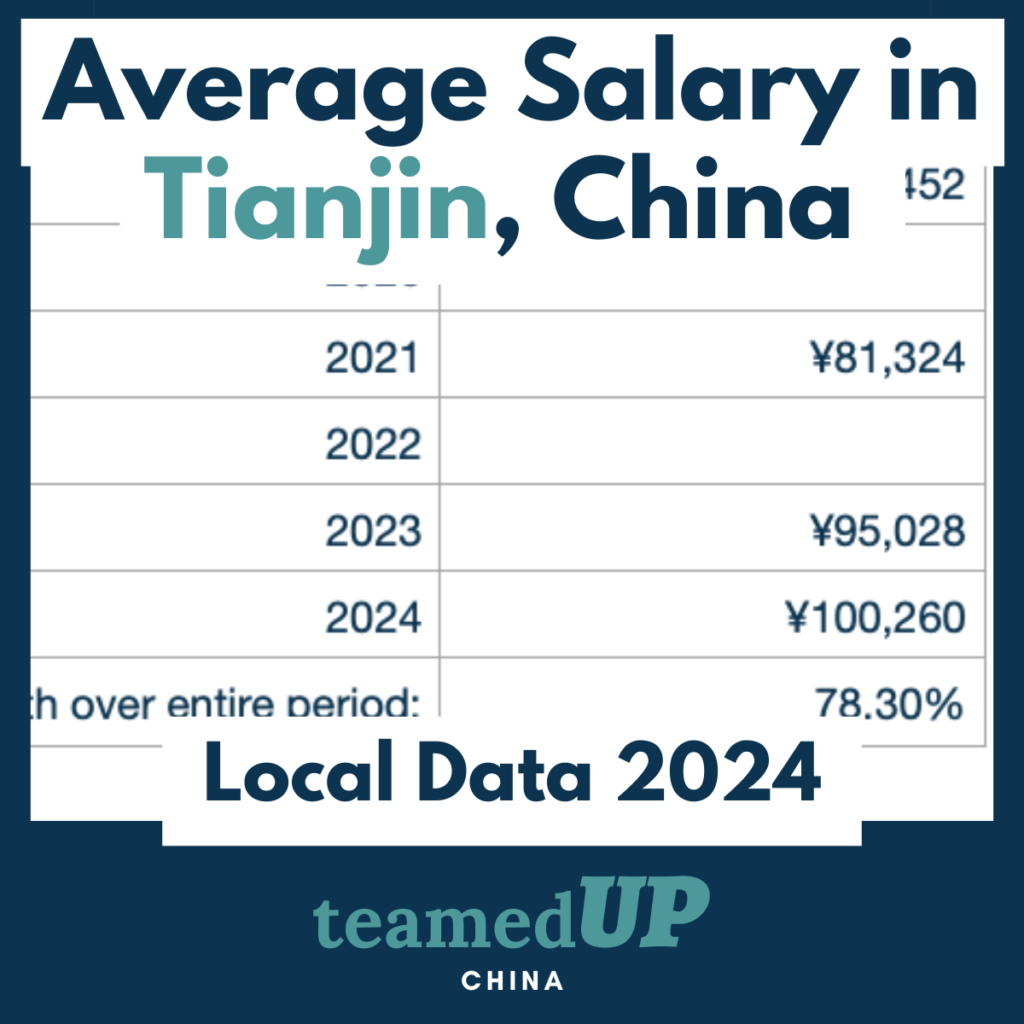
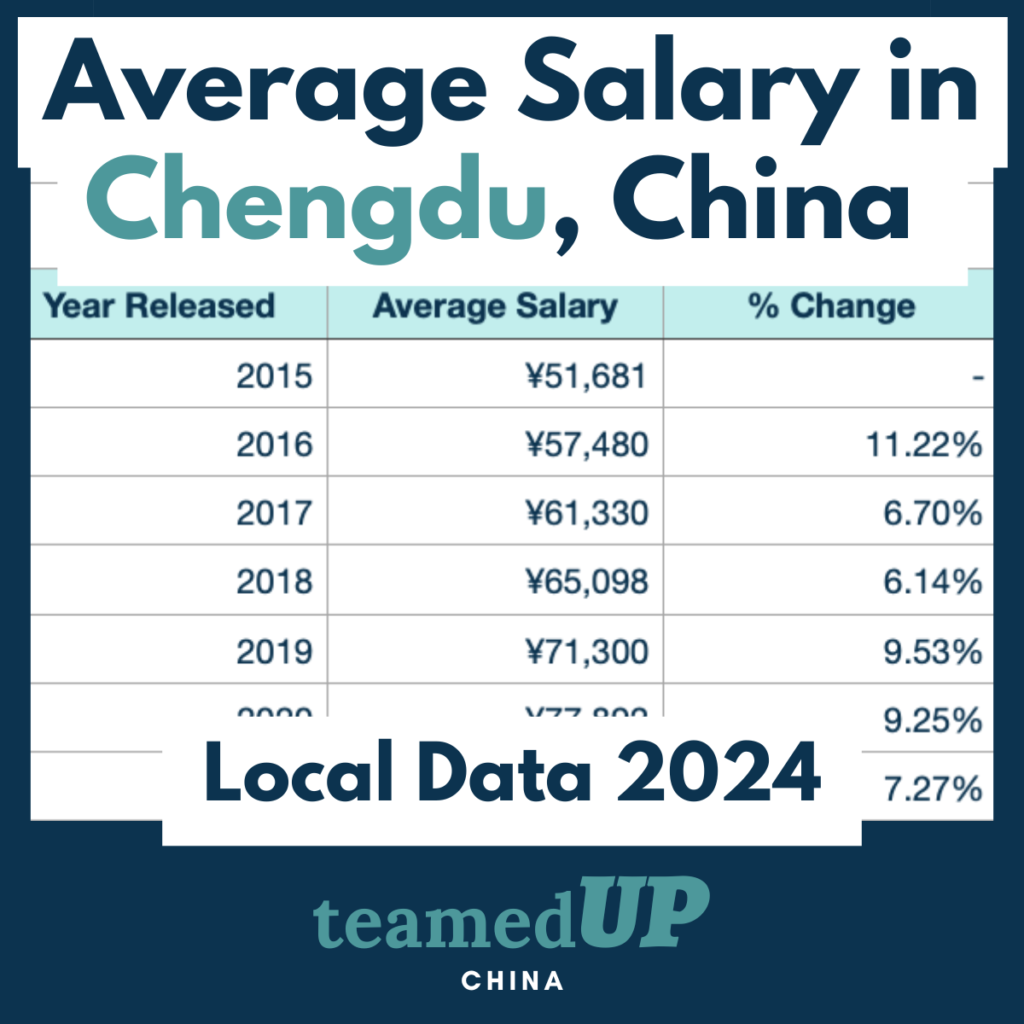
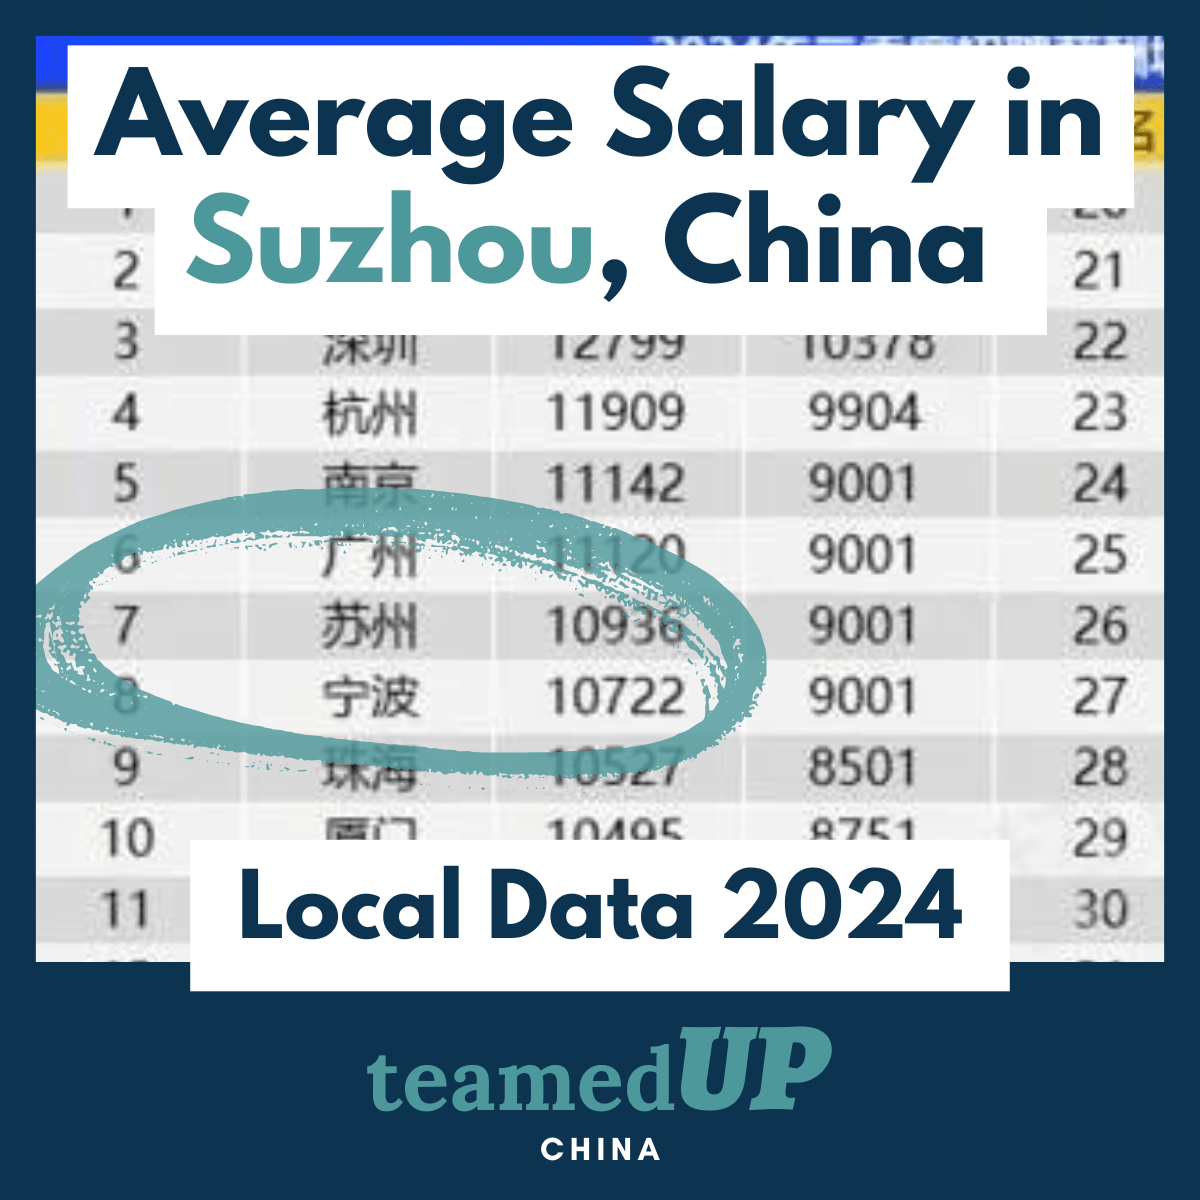
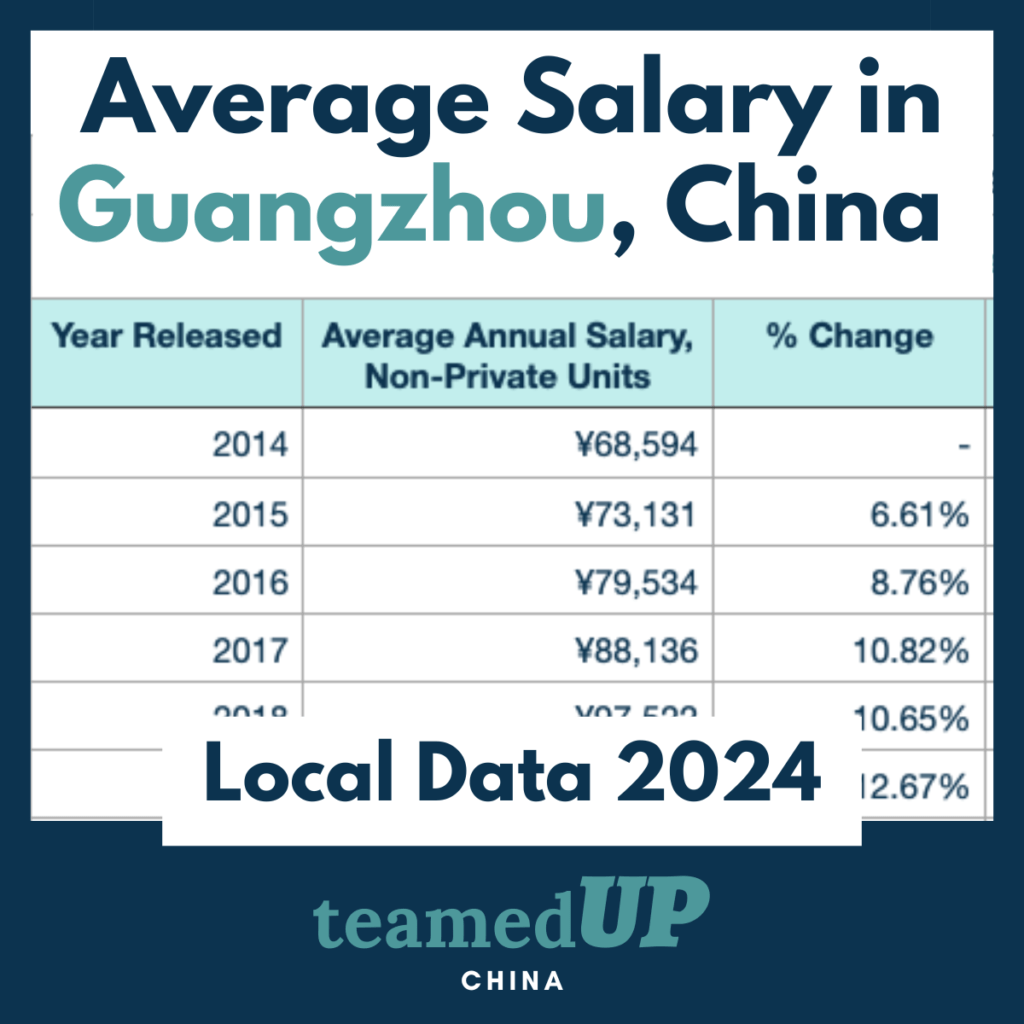
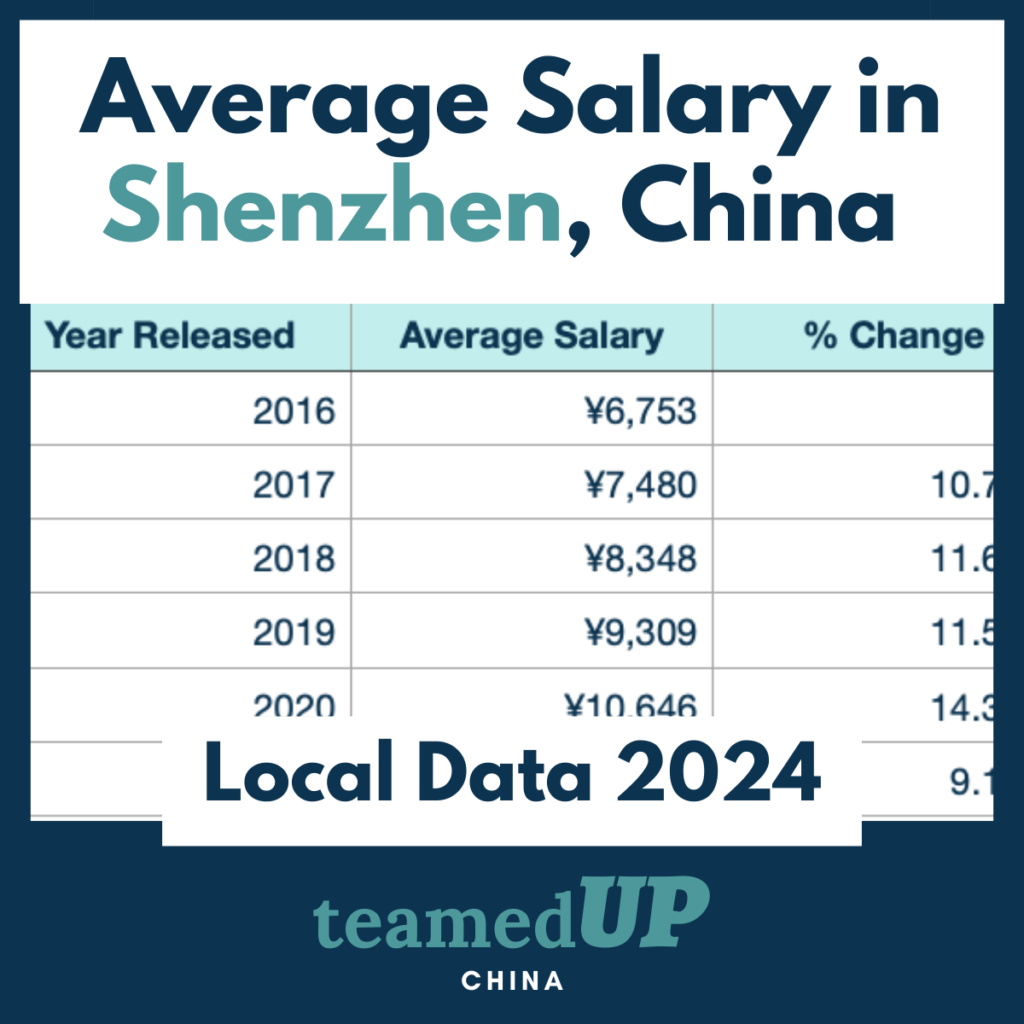
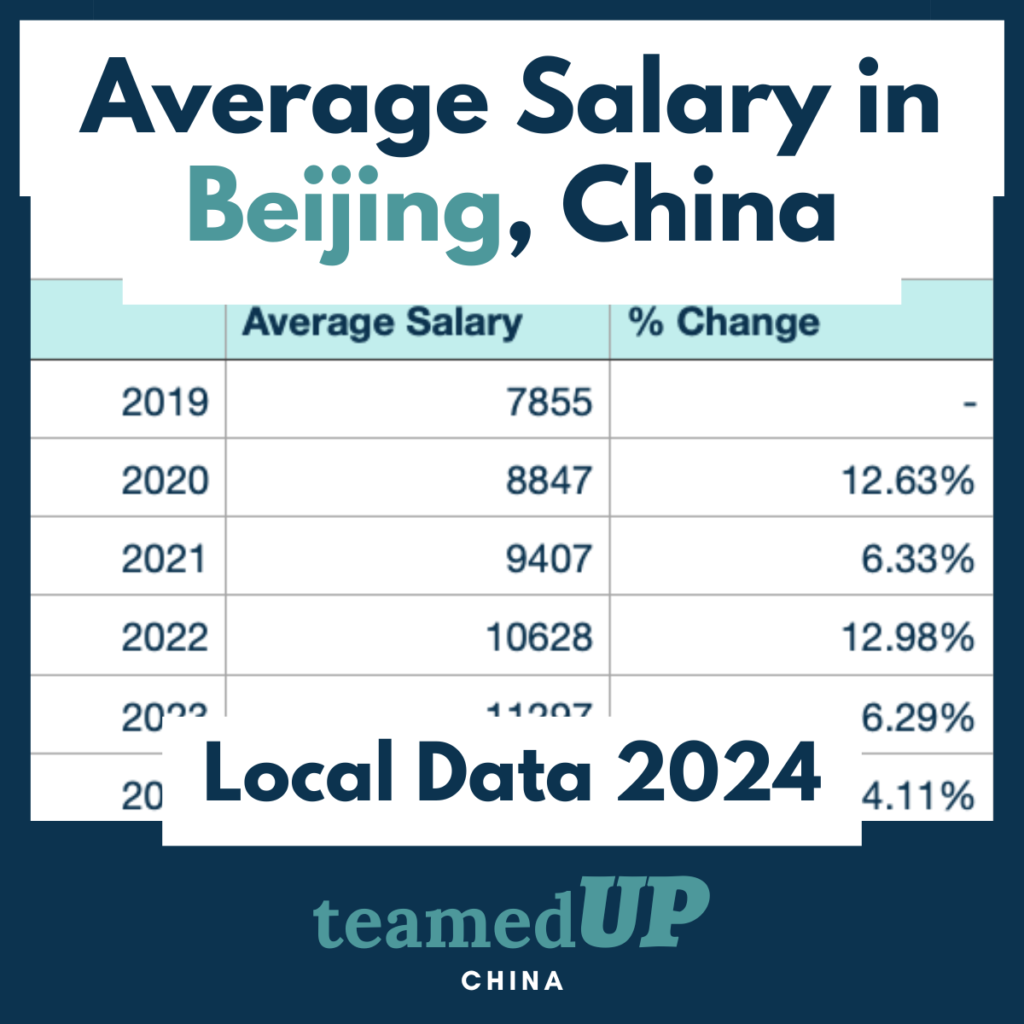
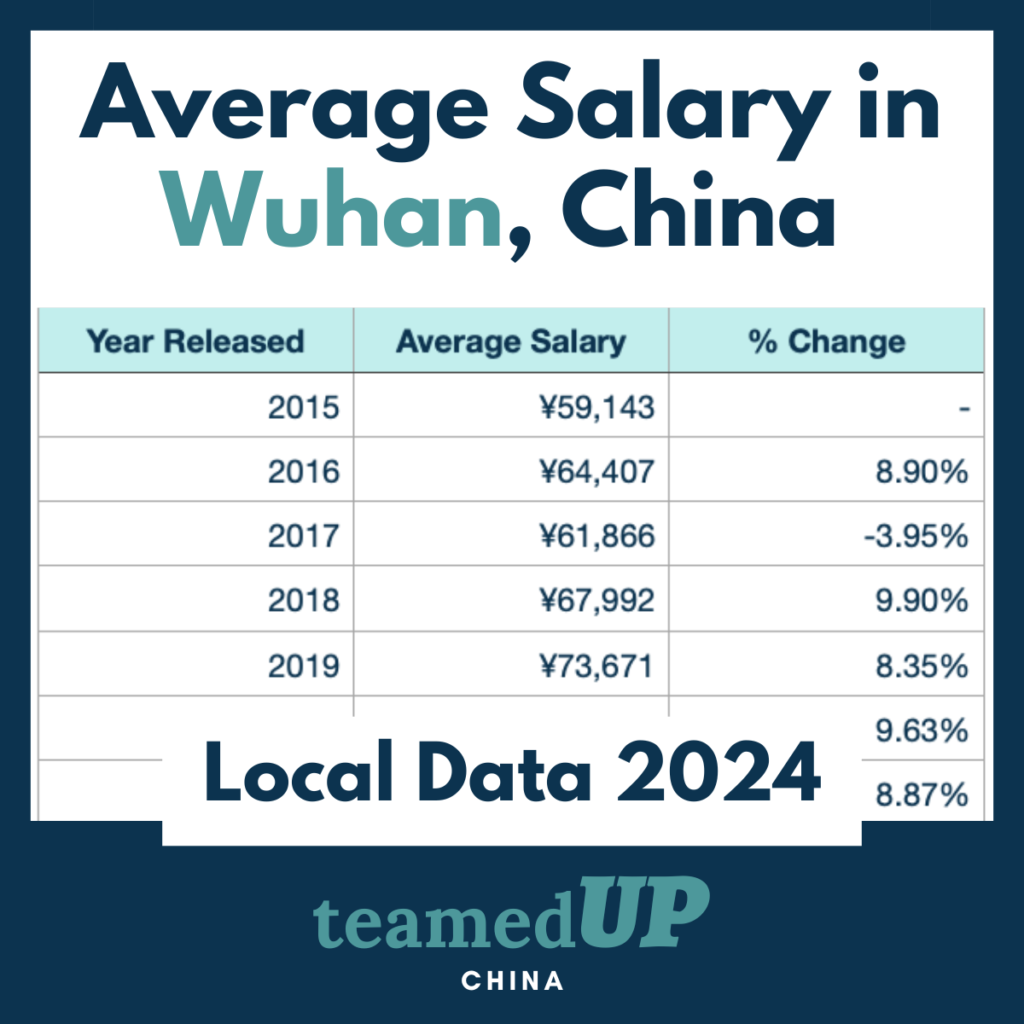
The city of Wuhan is one of the largest in China and a major economic, transportation, and research hub. Today we’re breaking down multiple sources of public, local data to see what the average salary level really is in this megacity. So let’s get to it! A dive into some 2024 Wuhan salary data…   💡 Why not use data from international sources, you ask? When it comes to salary figures in China, we’ve found a big discrepancy in the data provided by most outlets. Hiring in China? We can help. Post open roles across China’s top job sites, classifieds, and networking platforms — lower hiring costs by over 80%. Edit Template Average Salary in Wuhan: Government Data Wuhan Statistics Bureau In June 2024, Wuhan’s Statistics Bureau[2] released its most recent data on salaries. The figures represent wage data collected throughout 2023. Average annual salary: ¥110,134 RMB ($15,660 USD) Average monthly salary: ¥9,178 RMB ($1,305 USD) Data considerations The report defines total wages: Total wages refer to the total amount of labor remuneration directly paid to employees of the unit during the reporting period (quarter or year). It includes time wages, piece wages, bonuses, allowances and subsidies, overtime wages, and wages paid under special circumstances. The total wage is the pre-tax wage, including personal income tax, social insurance funds, housing provident fund and other personal contributions. and which companies, or ‘urban units’, are included here: Urban units: refers to legal entities with 5 or more employees in urban areas, excluding individual businesses and self-employed professionals. Wuhan’s Historic Salary Growth In the 2023 bureau report (reflecting 2022 wages), the average annual salary in the public category was listed as ¥103,308 RMB ($14,689 USD), marking an annual increase of 6.61%.  If we look further back into the bureau’s reports, the average wage in Nanjing has risen nearly 90% since the 2015 report: Average Salary in Wuhan: Local HR Data Wuhan Salary Data (Zhilian Zhaopin) Local HR giant Zhaopin regularly releases salary data for cities across China. The above photo shows the top 38 cities’ average and median salary levels in Q2 2024. Wuhan came in at the #11 spot with an average monthly salary of ¥10,261 RMB ($1,459 USD)/month. Wuhan’s median salary here is ¥8,501 RMB ($1,208 USD)/month.   Compared to Other Top Cities Shanghai took the first spot with an average monthly salary of ¥13,732 RMB ($1,933 USD)/month. Beijing ranked second with an average monthly salary of ¥13,351 RMB ($1,874 USD)/month. Shenzhen comes in at the #3 spot with an average monthly salary of ¥12,799 RMB ($1,796 USD)/month. Hangzhou, Nanjing, Guangzhou, Suzhou, and Ningbo round out the top 8. We also have median salary data here and can see the median of the top 3 cities – Shanghai, Beijing, and Shenzhen – all exceeded ¥10,000 RMB ($1,393 USD)/month. The median of the top 19 cities (including Wuhan) all exceeded ¥8,000 RMB ($1,137 USD)/month It’s also interesting to note that there is a 59% difference in the median salary between the first (Shanghai) and last (Harbin) cities on this list. Related Resources: Average Salary in Shanghai China: Local Data Breakdowns (2024) Salary Data for 8 of China’s Leading Tech Companies (2024) Average Salary Ranges for New University Graduates in China Top 10 Highest Paying Cities in China (2024) Average Salary in China: Local Data 2023+2024 Hiring in China? We can help, and likely lower your hiring costs by over 80% We’ve been recruiting in China since 2014! Our China Candidate Sourcing Service helps companies post & promote open roles across top Chinese jobs & networking platforms. Let’s find your next great China-based team member together.  Book A Call Post a Job Contact us to discuss hiring goals, salary & compensation budgets, and if TeamedUp China is the right fit to support your organization. New here? Get 26% off your first job post with us. Edit Template

Average Salary in Wuhan China: Local Data Breakdowns (2024) Read More »

Average Salary in Nanjing China - TeamedUp China

Average Salary in Nanjing China: Local Data Breakdowns (2024)

The ancient capital of Nanjing is one of the largest cities in China and one of the country’s top 10 highest-paying. It is also one of the key hubs of the Yangtze River Delta, along with other giants like Shanghai, Nanjing, Hangzhou, Suzhou, Ningbo, and Wuxi. Today we’re breaking down multiple sources of public, local data to see what the average salary level really is in this megacity. So let’s get to it! A dive into some 2024 Nanjing salary data…   💡 Why not use data from international sources, you ask? When it comes to salary figures in China, we’ve found a big discrepancy in the data provided by most outlets. Hiring in China? We can help. Post open roles across China’s top job sites, classifieds, and networking platforms — lower hiring costs by over 80%. Edit Template Average Salary in Nanjing: Government Data Nanjing Statistics Bureau In July 2024, Nanjing’s Statistics Bureau[2] released its most recent data on salaries. The figures represent wage data collected throughout 2023. They specifically split up the data into private and non-private categories.  Non-Private Jobs Average annual income: ¥154,206 RMB ($21,870 USD) Average monthly income: ¥12,851 RMB ($1,822 USD)   Private Jobs Average annual income: ¥82,311 RMB ($11,674 USD) Average monthly income: ¥6,859 RMB ($972 USD) Data considerations The report also specifies what exactly the term ‘total wages‘ means here: Total wages refer to the total amount of labor remuneration directly paid to employees of the unit during the reporting period (quarter or year). It includes time wages, piece wages, bonuses, allowances and subsidies, overtime wages, and wages paid under special circumstances. The total wage is the pre-tax wage, including personal income tax, social insurance funds, housing provident fund and other personal contributions. On private vs non-private categories: Private legal entities specifically include: private limited liability companies, private joint stock companies, sole proprietorships and partnerships among domestic enterprises. Non-private legal entities in urban areas specifically include: domestic-funded (including government agencies and public institutions) units other than private units, Hong Kong, Macao and Taiwan-invested enterprises, and foreign-invested enterprises. The data collection method seems to be a self-reported survey, likely required for submission by legal entities (as this is a government bureau after all): A comprehensive survey method is adopted for legal entities that use one set of forms, and a sampling survey method is adopted for legal entities that do not use one set of forms. Nanjing’s Historic Salary Growth In the 2023 bureau report (reflecting 2022 wages), the average annual salary in the public category was listed as ¥149,214 RMB ($21,162 USD), an increase of 3.35% from the previous year.  If we look further back into the bureau’s reports, the average wage in Nanjing has risen nearly 140% since the 2014 report: Average Salary in Nanjing: Local HR Data Nanjing Salary Data (Zhilian Zhaopin) Local HR giant Zhaopin regularly releases salary data for cities across China. The above photo shows the top 38 cities’ average and median salary levels in Q2 2024. Nanjing came in at the #5 spot with an average monthly salary of ¥11,142 RMB ($1,580 USD)/month. Nanjing’s median salary here is ¥9,001 RMB ($1,276 USD)/month.   Compared to Other Top Cities Shanghai took the first spot with an average monthly salary of ¥13,732 RMB ($1,933 USD)/month. Beijing ranked second with an average monthly salary of ¥13,351 RMB ($1,874 USD)/month. Shenzhen comes in at the #3 spot with an average monthly salary of ¥12,799 RMB ($1,796 USD)/month. Hangzhou, Nanjing, Guangzhou, Suzhou, and Ningbo round out the top 8.   We also have median salary data here and can see the median of the top 3 cities – Shanghai, Beijing, and Shenzhen – all exceeded ¥10,000 RMB ($1,393 USD)/month. The median of the top 8 cities (including Nanjing) all exceeded ¥9,000 RMB ($1,267 USD)/month It’s also interesting to note that there is a 59% difference in the median salary between the first (Shanghai) and last (Harbin) cities on this list. Related Resources: Average Salary in Suzhou China: Local Data Breakdowns (2024) Salary Data for 8 of China’s Leading Tech Companies (2024) Average Salary Ranges for New University Graduates in China Top 10 Highest Paying Cities in China (2024) Average Salary in China: Local Data 2023+2024 Hiring in China? We can help, and likely lower your hiring costs by over 80% We’ve been recruiting in China since 2014! Our China Candidate Sourcing Service helps companies post & promote open roles across top Chinese jobs & networking platforms. Let’s find your next great China-based team member together.  Book A Call Post a Job Contact us to discuss hiring goals, salary & compensation budgets, and if TeamedUp China is the right fit to support your organization. New here? Get 26% off your first job post with us. Edit Template

Average Salary in Nanjing China: Local Data Breakdowns (2024) Read More »

Average Salary in Chongqing China - TeamedUp China

Average Salary in Chongqing China: Local Data Breakdowns (2024)

The city of Chongqing is one of the (or the[1]) largest in China. Today we’re breaking down multiple sources of public, local data to see what the average salary level really is in this megacity.  So let’s get to it! A dive into some 2024 Chongqing salary data…   💡 Why not use data from international sources, you ask? When it comes to salary figures in China, we’ve found a big discrepancy in the data provided by most outlets. Hiring in China? We can help. Post open roles across China’s top job sites, classifieds, and networking platforms — lower hiring costs by over 80%. Edit Template Average Salary in Chongqing: Government Data Chongqing Statistics Bureau In June 2024, Chongqing’s Statistics Bureau[2] released its most recent data on salaries. The figures represent wage data collected throughout 2023. They specifically split up the data into private and non-private categories.  Non-Private Jobs Average annual income: ¥113,653 RMB ($16,112 USD) Average monthly income: ¥9,471 RMB ($1,342 USD) Annual Increase: 6.2%   Private Jobs Average annual income: ¥63,941 RMB ($9,064 USD) Average monthly income: ¥5,328 RMB ($755 USD) Annual Increase: 5.9%   Personnel Categories The Bureau further dove into average salaries in the city with ‘personnel’ categories. Here is the annual average wage for each of these- Middle-level and above managers: ¥169,106 RMB ($23,974 USD) Professional and technical personnel: ¥115,723 RMB ($16,405 USD) Office and related personnel: ¥75,372 RMB ($10,685 USD) Social production and life service personnel: ¥62,067 RMB ($8,799 USD) Production and manufacturing and related personnel: ¥69,709 RMB ($9,882 USD)   Just a note that only ‘Enterprises above a designated size’ were used for these categories.  Data considerations The report also specifies what exactly the term ‘total wages‘ means here: Total wages refer to the total amount of labor remuneration directly paid to employees of the unit during the reporting period (quarter or year). It includes time wages, piece wages, bonuses, allowances and subsidies, overtime wages, and wages paid under special circumstances. The total wage is the pre-tax wage, including personal income tax, social insurance funds, housing provident fund and other personal contributions. On private vs non-private categories: Private legal entities specifically include: private limited liability companies, private joint stock companies, sole proprietorships and partnerships among domestic enterprises. Non-private legal entities in urban areas specifically include: domestic-funded (including government agencies and public institutions) units other than private units, Hong Kong, Macao and Taiwan-invested enterprises, and foreign-invested enterprises. The data collection method described in the report does leave this writer wanting a bit more clarification (a trend among city statistics bureaus). It seems to be a self-reported survey, likely required for submission by legal entities (as this is a government bureau after all). Here it is from the report: A comprehensive survey method is adopted for legal entities that use one set of forms, and a sampling survey method is adopted for legal entities that do not use one set of forms. Average Salary in Chongqing: Local HR Data Chongqing Salary Data (Zhilian Zhaopin) Local HR giant Zhaopin regularly releases salary data for cities across China. The above photo shows the top 38 cities’ average and median salary levels in Q2 2024. Chongqing came in at the #22 spot with an average monthly salary of ¥9,266 RMB ($1,313 USD)/month. Chongqing’s median salary here is ¥7,501 RMB ($1,127 USD)/month.   Compared to Other Top Cities Shanghai took the first spot with an average monthly salary of ¥13,732 RMB ($1,933 USD)/month. Beijing ranked second with an average monthly salary of ¥13,351 RMB ($1,874 USD)/month. Shenzhen comes in at the #3 spot with an average monthly salary of ¥12,799 RMB ($1,796 USD)/month. Hangzhou, Nanjing, Guangzhou, Suzhou, and Ningbo round out the top 8. Chongqing has a similar salary level to Qingdao (#21) and Tianjin (#24).   We also have median salary data here and can see the median of the top 3 cities – Shanghai, Beijing, and Shenzhen – all exceeded ¥10,000 RMB ($1,393 USD)/month. The median of the top 8 cities all exceeded ¥9,000 RMB ($1,267 USD)/month The median of the top 28 cities (including Chongqing) all exceeded ¥7,500 RMB ($1,057 USD)/month It’s also interesting to note that there is a 59% difference in the median salary between the first (Shanghai) and last (Harbin) cities on this list. Related Resources: Average Salary in Chengdu China: Local Data Breakdowns (2024) Salary Data for 8 of China’s Leading Tech Companies (2024) Average Salary Ranges for New University Graduates in China Top 10 Highest Paying Cities in China (2024) Average Salary in China: Local Data 2023+2024 Hiring in China? We can help, and likely lower your hiring costs by over 80% We’ve been recruiting in China since 2014! Our China Candidate Sourcing Service helps companies post & promote open roles across top Chinese jobs & networking platforms. Let’s find your next great China-based team member together.  Book A Call Post a Job Contact us to discuss hiring goals, salary & compensation budgets, and if TeamedUp China is the right fit to support your organization. New here? Get 26% off your first job post with us. Edit Template

Average Salary in Chongqing China: Local Data Breakdowns (2024) Read More »

Average Salary in Tianjin China - TeamedUp China

Average Salary in Tianjin China: Local Data Breakdowns (2024)

The city of Tianjin is one of the largest in China, with over 14 million people calling it their home.[1] Today we’re breaking down multiple sources of public, local data to see what the average salary level really is in this megacity.  So let’s get to it! A dive into some 2024 Tianjin salary data…   💡 Why not use data from international sources, you ask? When it comes to salary figures in China, we’ve found a big discrepancy in the data provided by most outlets. Hiring in China? We can help. Post open roles across China’s top job sites, classifieds, and networking platforms — lower hiring costs by over 80%. Edit Template Average Salary in Tianjin: Government Data Tianjin Municipal Government In July 2024, Tianjin’s Municipal People’s Government[2] released its most recent data on salaries. The figures represent wage data collected throughout 2023.   Average annual income: ¥100,260 RMB ($14,134 USD) Average monthly income: ¥8,355 RMB ($1,177 USD) Data considerations The report also specifies what exactly the term ‘total wages‘ means here: Total wages: It includes time wages, piece wages, bonuses, allowances and subsidies, overtime wages, wages paid under special circumstances, and is the sum of the total wages of on-the-job employees, the total wages of dispatched employees, and the total wages of other employees The data collection method described in the report does leave this writer wanting a bit more clarification (a trend among city statistics bureaus). It seems to be a self-reported survey, likely required for submission by legal entities (as this is a government bureau after all). Here it is from the report: A comprehensive survey method is adopted for legal entities that use one set of forms, and a sampling survey method is adopted for legal entities that do not use one set of forms. Tianjin’s Historic Salary Growth In the 2023 bureau report (reflecting 2022 wages), the average annual salary in the public category was listed as ¥95,028 RMB ($13,396 USD), an increase of 5.5% from the previous year.  If we look further back into the bureau’s reports, the average wage in Tianjin has risen nearly 80% since the 2015 report: Average Salary in Tianjin: Local HR Data Tianjin Salary Data (Zhilian Zhaopin) Local HR giant Zhaopin regularly releases salary data for cities across China. The above photo shows the top 38 cities’ average and median salary levels in Q2 2024. Tianjin came in at the #24 spot with an average monthly salary of ¥9,031 RMB ($1,273 USD)/month. Tianjin’s median salary here is ¥7,501 RMB ($1,127 USD)/month.   Compared to Other Top Cities Shanghai took the first spot with an average monthly salary of ¥13,732 RMB ($1,933 USD)/month. Beijing ranked second with an average monthly salary of ¥13,351 RMB ($1,874 USD)/month. Shenzhen comes in at the #3 spot with an average monthly salary of ¥12,799 RMB ($1,796 USD)/month. Hangzhou, Nanjing, Suzhou, and Ningbo round out the top 8. We also have median salary data here and can see the median of the top 3 cities – Shanghai, Beijing, and Shenzhen – all exceeded ¥10,000 RMB ($1,393 USD)/month. The median of the top 8 cities all exceeded ¥9,000 RMB ($1,267 USD)/month The median of the top 28 cities (including Tianjin) all exceeded ¥7,500 RMB ($1,057 USD)/month It’s also interesting to note that there is a 59% difference in the median salary between the first (Shanghai) and last (Harbin) cities on this list. Related Resources: Average Salary in Shenzhen China: Local Data Breakdowns (2024) Salary Data for 8 of China’s Leading Tech Companies (2024) Average Salary Ranges for New University Graduates in China Top 10 Highest Paying Cities in China (2024) Average Salary in China: Local Data 2023+2024 Hiring in China? We can help, and likely lower your hiring costs by over 80% We’ve been recruiting in China since 2014! Our China Candidate Sourcing Service helps companies post & promote open roles across top Chinese jobs & networking platforms. Let’s find your next great China-based team member together.  Book A Call Post a Job Contact us to discuss hiring goals, salary & compensation budgets, and if TeamedUp China is the right fit to support your organization. New here? Get 26% off your first job post with us. Edit Template

Average Salary in Tianjin China: Local Data Breakdowns (2024) Read More »

Average Salary in Chengdu China - TeamedUp China

Average Salary in Chengdu China: Local Data Breakdowns (2024)

The western city of Chengdu is one of the largest in China, with over 20 million people calling it their home.[1] Today we’re breaking down multiple sources of public, local data to see what the average salary level really is in this megacity.  So let’s get to it! A dive into some 2024 Chengdu salary data…   💡 Why not use data from international sources, you ask? When it comes to salary figures in China, we’ve found a big discrepancy in the data provided by most outlets. Hiring in China? We can help. Post open roles across China’s top job sites, classifieds, and networking platforms — lower hiring costs by over 80%. Edit Template Average Salary in Chengdu: Government Data Chengdu Statistics Bureau In June 2024, Chengdu’s Municipal Bureau of Statistics[2] released its most recent data on salaries. The figures represent wage data collected throughout 2023. All jobs Average annual income: ¥100,606 RMB ($14,182 USD) Average monthly income: ¥8,384 RMB ($1,181 USD) Annual Increase: 4.3% (4.1% after inflation) They further broke down the salary figures into private and non-private job categories: Public jobs Average annual income: ¥125,448 RMB ($17,684 USD) Average monthly income: ¥10,454 RMB ($1,473 USD) Annual Increase: 6.8%   Private Jobs Average annual income: ¥67,834 RMB ($9,562 USD) Average monthly income: ¥5,653 RMB ($796 USD) Annual Increase: 4.2%   Data considerations The first thing to consider here is what they deemed private vs public. From the report: Private entities specifically include: private limited liability companies, private joint stock companies, sole proprietorships and partnerships among domestic enterprises. Non-private entities specifically include: domestic-funded (including government agencies and public institutions) units other than private units, Hong Kong, Macao and Taiwan-invested enterprises, and foreign-invested enterprises. The report also specifies what exactly the term ‘total wages‘ means here: Total wages: It includes time wages, piece wages, bonuses, allowances and subsidies, overtime wages, wages paid under special circumstances, and is the sum of the total wages of on-the-job employees, the total wages of dispatched employees, and the total wages of other employees The data collection method described in the report does leave this writer wanting a bit more clarification (a trend among city statistics bureaus). It seems to be a self-reported survey, likely required for submission by legal entities (as this is a government bureau after all). Here it is from the report: A comprehensive survey method is adopted for legal entities that use one set of forms, and a sampling survey method is adopted for legal entities that do not use one set of forms. Chengdu’s Historic Salary Growth In the 2023 bureau report (reflecting 2022 wages), the average annual salary in the public category was listed as ¥96,413 RMB ($13,591 USD), an increase of 5.0% from the previous year (2.5% after inflation).  If we look further back into the bureau’s reports, the average wage in Chengdu has risen nearly 95% since the 2015 report: Average Salary in Chengdu: Local HR Data Chengdu Salary Data (Zhilian Zhaopin) Local HR giant Zhaopin regularly releases salary data for cities across China. The above photo shows the top 38 cities’ average and median salary levels in Q2 2024. Chengdu came in at the #17 spot with an average monthly salary of ¥9,813 RMB ($1,383 USD)/month. Chengdu’s median salary here is ¥8,001 RMB ($1,127 USD)/month.   Compared to Other Top Cities Shanghai took the first spot with an average monthly salary of ¥13,732 RMB ($1,933 USD)/month. Beijing ranked second with an average monthly salary of ¥13,351 RMB ($1,874 USD)/month. Shenzhen comes in at the #3 spot with an average monthly salary of ¥12,799 RMB ($1,796 USD)/month. Hangzhou, Nanjing, Suzhou, and Ningbo round out the top 8. We also have median salary data here and can see the median of the top 3 cities – Shanghai, Beijing, and Shenzhen – all exceeded ¥10,000 RMB ($1,393 USD)/month. The median of the top 8 cities all exceeded ¥9,000 RMB ($1,267 USD)/month The median of the top 19 cities (including Chengdu) all exceeded ¥8,000 RMB ($1,127 USD)/month It’s also interesting to note that there is a 59% difference in the median salary between the first (Shanghai) and last (Harbin) cities on this list. Related Resources: Average Salary in Shenzhen China: Local Data Breakdowns (2024) Salary Data for 8 of China’s Leading Tech Companies (2024) Average Salary Ranges for New University Graduates in China Top 10 Highest Paying Cities in China (2024) Average Salary in China: Local Data 2023+2024 Hiring in China? We can help, and likely lower your hiring costs by over 80% We’ve been recruiting in China since 2014! Our China Candidate Sourcing Service helps companies post & promote open roles across top Chinese jobs & networking platforms. Let’s find your next great China-based team member together.  Book A Call Post a Job Contact us to discuss hiring goals, salary & compensation budgets, and if TeamedUp China is the right fit to support your organization. New here? Get 26% off your first job post with us. Edit Template

Average Salary in Chengdu China: Local Data Breakdowns (2024) Read More »

Average Salary in Suzhou China - TeamedUp China

Average Salary in Suzhou China: Local Data Breakdowns (2024)

The storied city of Suzhou is one of the top 10 highest-paying cities in China. Today we’re breaking down multiple sources of public, local data to see what the average salary level really is in this megacity.  So let’s get to it! A dive into some 2024 Suzhou salary data…   💡 Why not use data from international sources, you ask? When it comes to salary figures in China, we’ve found a big discrepancy in the data provided by most outlets. Hiring in China? We can help. Post open roles across China’s top job sites, classifieds, and networking platforms — lower hiring costs by over 80%. Edit Template Average Salary in Suzhou: Government Data Suzhou Statistics Bureau In July 2024, Suzhou’s Statistics Bureau[1] released its most recent data on urban salaries. The figures represent wage data collected throughout 2023. They specifically split up the salary figures into private and non-private categories. Suzhou is one of the, if not the, main manufacturing hubs in eastern China’s Yangzte River Delta[2] and one of the biggest in the world. Because of this, the private jobs data has a large group made up of domestic manufacturers. Public jobs Average annual income: ¥137,092 RMB ($19,326 USD) Average monthly income: ¥11,424 RMB ($1,610 USD)   Private Jobs Average annual income: ¥83,962 RMB ($11,836 USD) Average monthly income: ¥6,997 RMB ($986 USD)   Data considerations: The first thing to consider here is what they deemed private vs public. From the report: Private entities specifically include: private limited liability companies, private joint stock companies, sole proprietorships and partnerships among domestic enterprises. Non-private entities specifically include: domestic-funded (including government agencies and public institutions) units other than private units, Hong Kong, Macao and Taiwan-invested enterprises, and foreign-invested enterprises. The report also specifies what exactly the term ‘total wages‘ means here: Total wages: It includes time wages, piece wages, bonuses, allowances and subsidies, overtime wages, wages paid under special circumstances, and is the sum of the total wages of on-the-job employees, the total wages of dispatched employees, and the total wages of other employees The data collection method described in the report does leave this writer wanting a bit more clarification (a trend among city statistics bureaus). It seems to be a self-reported survey, likely required for submission by legal entities (as this is a government bureau after all). Here it is from the report: A comprehensive survey method is adopted for legal entities that use one set of forms, and a sampling survey method is adopted for legal entities that do not use one set of forms. Average Salary in Suzhou: Local HR Data Suzhou Salary Data (Zhilian Zhaopin) Local HR giant Zhaopin regularly releases salary data for cities across China. The above photo shows the top 38 cities’ average and median salary levels in Q2 2024. Suzhou came in at the #7 spot with an average monthly salary of ¥10,936 RMB ($1,541 USD)/month. Suzhou’s median salary here is ¥9,001 RMB ($1,267 USD)/month.   Compared to Other Top Cities Shanghai took the first spot with an average monthly salary of ¥13,732 RMB ($1,933 USD)/month. Beijing ranked second with an average monthly salary of ¥13,351 RMB ($1,874 USD)/month. Shenzhen comes in at the #3 spot with an average monthly salary of ¥12,799 RMB ($1,796 USD)/month. Hangzhou, Nanjing, Suzhou, and Ningbo round out the top 8. We also have median salary data here and can see the median of the top 3 cities – Shanghai, Beijing, and Shenzhen – all exceeded ¥10,000 RMB ($1,393 USD)/month. The median of the top 8 cities (including Suzhou) all exceeded ¥9,000 RMB ($1,267 USD)/month It’s also interesting to note that there is a 59% difference in the median salary between the first (Shanghai) and last (Harbin) cities on this list. Related Resources: Average Salary in Shenzhen China: Local Data Breakdowns (2024) Salary Data for 8 of China’s Leading Tech Companies (2024) Average Salary Ranges for New University Graduates in China Top 10 Highest Paying Cities in China (2024) Average Salary in China: Local Data 2023+2024 Hiring in China? We can help, and likely lower your hiring costs by over 80% We’ve been recruiting in China since 2014! Our China Candidate Sourcing Service helps companies post & promote open roles across top Chinese jobs & networking platforms. Let’s find your next great China-based team member together.  Book A Call Post a Job Contact us to discuss hiring goals, salary & compensation budgets, and if TeamedUp China is the right fit to support your organization. New here? Get 26% off your first job post with us. Edit Template

Average Salary in Suzhou China: Local Data Breakdowns (2024) Read More »

Average Salary in Guangzhou China - TeamedUp China

Average Salary in Guangzhou China: Local Data Breakdowns (2024)

The mighty metropolis of Guangzhou is one of the top 10 highest-paying cities in China, as well as a manufacturing powerhouse. Today we’re breaking down multiple sources of public, local data to see what the average salary level really is in this megacity.  So let’s get to it! A dive into some 2024 Guangzhou salary data…   💡 Why not use data from international sources, you ask? When it comes to salary figures in China, we’ve found a big discrepancy in the data provided by most outlets. Hiring in China? We can help. Post open roles across China’s top job sites, classifieds, and networking platforms — lower hiring costs by over 80%. Edit Template Average Salary in Guangzhou: Government Data Guangzhou Statistics Bureau In July 2024, Guangzhou’s Statistics Bureau[1] released its most recent data on urban salaries. The figures represent wage data collected throughout 2023. They specifically split up the salary figures into private and non-private categories. Guangzhou is the main manufacturing hub in southern China’s Pearl River Delta[2] and one of the (if not the) biggest in the world. Because of this, the private jobs data is largely made up of domestic manufacturers. Public jobs Average annual income: ¥154,475 RMB ($21,720 USD) Average monthly income: ¥12,872 RMB ($1,809 USD) Annual Increase: 4.4% (3.4% after inflation)   Private Jobs Average annual income: ¥81,911 RMB ($11,517 USD) Average monthly income: ¥6,825 RMB ($959 USD) Annual Increase: 4.0% (2.9% after inflation)   Data considerations: The first thing to consider here is what they deemed private vs public. From the report: Private entities specifically include: private limited liability companies, private joint stock companies, sole proprietorships and partnerships among domestic enterprises. Non-private entities specifically include: domestic-funded (including government agencies and public institutions) units other than private units, Hong Kong, Macao and Taiwan-invested enterprises, and foreign-invested enterprises. The report also specifies what exactly the term ‘total wages‘ means here: Total wages: It includes time wages, piece wages, bonuses, allowances and subsidies, overtime wages, wages paid under special circumstances, and is the sum of the total wages of on-the-job employees, the total wages of dispatched employees, and the total wages of other employees The data collection method described in the report does leave this writer wanting a bit more clarification (a trend among city statistics bureaus). It seems to be a self-reported survey, likely required for submission by legal entities (as this is a government bureau after all). Here it is from the report: A comprehensive survey method is adopted for legal entities that use one set of forms, and a sampling survey method is adopted for legal entities that do not use one set of forms. Guangzhou’s Historic Salary Growth In the 2023 bureau report (reflecting 2022 wages), the average annual salary in the public category was listed as ¥147,947 RMB ($20,802 USD), an increase of 4.41% from the previous year.  If we look further back into the bureau’s reports, the average wage in Guangzhou has risen over 125% since the 2014 report: Average Salary in Guangzhou: Local HR Data Guanzhou Salary Data (Zhilian Zhaopin) Local HR giant Zhaopin regularly releases salary data for cities across China. The above photo shows the top 38 cities’ average and median salary levels in Q2 2024. Guangzhou came in at the #6 spot with an average monthly salary of ¥11,120 RMB ($1,566 USD)/month. Guanzhou’s median salary here is ¥9,001 RMB ($1,267 USD)/month.   Compared to Other Top Cities Shanghai took the first spot with an average monthly salary of ¥13,732 RMB ($1,933 USD)/month. Beijing ranked second with an average monthly salary of ¥13,351 RMB ($1,874 USD)/month. Shenzhen comes in at the #3 spot with an average monthly salary of ¥12,799 RMB ($1,796 USD)/month. Hangzhou, Nanjing, Suzhou, and Ningbo round out the top 8. We also have median salary data here and can see the median of the top 3 cities – Shanghai, Beijing, and Shenzhen – all exceeded ¥10,000 RMB ($1,393 USD)/month. The median of the top 8 cities (including Guangzhou) all exceeded ¥9,000 RMB ($1,267 USD)/month It’s also interesting to note that there is a 59% difference in the median salary between the first (Shanghai) and last (Harbin) cities on this list. Related Resources: Average Salary in Shenzhen China: Local Data Breakdowns (2024) Salary Data for 8 of China’s Leading Tech Companies (2024) Average Salary Ranges for New University Graduates in China Top 10 Highest Paying Cities in China (2024) Average Salary in China: Local Data 2023+2024 Hiring in China? We can help, and likely lower your hiring costs by over 80% We’ve been recruiting in China since 2014! Our China Candidate Sourcing Service helps companies post & promote open roles across top Chinese jobs & networking platforms. Let’s find your next great China-based team member together.  Book A Call Post a Job Contact us to discuss hiring goals, salary & compensation budgets, and if TeamedUp China is the right fit to support your organization. New here? Get 26% off your first job post with us. Edit Template

Average Salary in Guangzhou China: Local Data Breakdowns (2024) Read More »

Average Salary in Shenzhen China - TeamedUp China

Average Salary in Shenzhen China: Local Data Breakdowns (2024)

Shenzhen, along with Shanghai and Beijing, is one of the 3 highest-paying cities in China. Today we’re breaking down multiple sources of public, local data to see what the average salary level really is in this megacity.  It’s important to note that the city serves as a global hub for both technology and manufacturing. Because of this, salaries tend to be more varied than in your average metropolis. So let’s get to it! A dive into some 2024 Shenzhen salary data…   💡 Why not use data from international sources, you ask? When it comes to salary figures in China, we’ve found a big discrepancy in the data provided by most outlets. Hiring in China? We can help. Post open roles across China’s top job sites, classifieds, and networking platforms — lower hiring costs by over 80%. Edit Template Average Salary in Shenzhen: Government Data Municipal Bureau of Statistics In June 2024, Shenzhen’s Municipal Bureau of Statistics[1] released its most recent data on urban salaries. The figures represent wage data collected throughout 2023. They specifically split up the salary figures into private and non-private categories. Public jobs Average annual income: ¥171,854 RMB ($24,127 USD) Average monthly income: ¥14,321 RMB ($2,010 USD) Annual Increase: 5.6% (4.8% after inflation)   Private Jobs Average annual income: ¥94,215 RMB ($13,227 USD) Average monthly income: ¥7,851 RMB ($1,102 USD) Annual Increase: 4.3% (3.5% after inflation)   Data considerations: The first thing to consider here is what they deemed private vs public. From the report: Private entities specifically include: private limited liability companies, private joint stock companies, sole proprietorships and partnerships among domestic enterprises. Non-private entities specifically include: domestic-funded (including government agencies and public institutions) units other than private units, Hong Kong, Macao and Taiwan-invested enterprises, and foreign-invested enterprises. The report also specifies what exactly the term ‘total wages’ means here: Total wages: The total amount of labor remuneration directly paid by the unit to its employees during the reporting period. It includes time wages, piece wages, bonuses, allowances and subsidies, overtime wages, and wages paid under special circumstances. The data collection method described in the report does leave this writer wanting a bit more clarification. It seems to be a self-reported survey, likely required for submission by legal entities (as this is a government bureau after all). Here it is from the report: A comprehensive survey method is adopted for legal entities that use one set of forms, and a sampling survey method is adopted for legal entities that do not use one set of forms. Shenzhen’s Historic Salary Growth In the 2023 bureau report (reflecting 2022 wages), the average monthly salary in the public category was listed as ¥13,557 RMB ($1,903 USD), an increase of 4.11% from the previous year into 2024.  If we look further back into the bureau’s reports, the average wage in Shenzhen has risen over 115% since the 2016 report: Average Salary in Shenzhen: Local HR Data Shenzhen Salary Data (Zhilian Zhaopin) Local HR giant Zhaopin regularly releases salary data for cities across China. The above photo shows the top 38 cities’ average and median salary levels in Q2 2024. Shenzhen comes in at the #3 spot again with an average monthly salary of ¥12,799 RMB ($1,796 USD)/month. Shenzhen’s median salary here is ¥10,378 RMB ($1,457 USD)/month.   Compared to Other Top Cities Shanghai took the first spot with an average monthly salary of ¥13,732 RMB ($1,933 USD)/month. Beijing ranked second with an average monthly salary of ¥13,351 RMB ($1,874 USD)/month. Hangzhou, Nanjing, Suzhou, Guangzhou, and Ningbo round out the top 8. We also have median salary data here and can see the median of the top 3 cities – Shanghai, Beijing, and Shenzhen – all exceeded ¥10,000 RMB ($1,393 USD)/month. It’s also interesting to note that there is a 59% difference in the median salary between the first (Shanghai) and last (Harbin) cities on this list. Related Resources: Average Salary in Beijing China: Local Data Breakdowns (2024) Average Salary in Shanghai China: Local Data Breakdowns (2024) Salary Data for 8 of China’s Leading Tech Companies (2024) Average Salary Ranges for New University Graduates in China Top 10 Highest Paying Cities in China (2024) Average Salary in China: Local Data 2023+2024 Hiring in China? We can help, and likely lower your hiring costs by over 80% We’ve been recruiting in China since 2014! Our China Candidate Sourcing Service helps companies post & promote open roles across top Chinese jobs & networking platforms. Let’s find your next great China-based team member together.  Book A Call Post a Job Contact us to discuss hiring goals, salary & compensation budgets, and if TeamedUp China is the right fit to support your organization. New here? Get 26% off your first job post with us. Edit Template

Average Salary in Shenzhen China: Local Data Breakdowns (2024) Read More »

Success Stories - UX Designer - TeamedUp China

How a Product Development Firm Hired a UX Designer in China

Success Stories is a regular series all about the talent our clients hire via TeamedUp China and how much they cost. New here? TeamedUp China helps companies simplify and save on their hiring process in China.   Note: Some clients prefer not to be named, so we’ve purposefully removed their specific names from this article. We’re their secret weapon 😉 What does the client’s business do? Our client helps global companies in the consumer products, food, and life sciences industries make products their consumers can trust. Their focus is on testing, inspection, and certification. Who was hired and what was their role? They were looking for a UX professional to join their design team and craft product-oriented designs for their client platforms. The focus was on providing design solutions that elevate the user experiences for their clients. They found Eric! Eric was responsible for: User Research and Analysis: Conducting user research to understand client needs, behaviors, and pain points. This includes interviews, surveys, and usability testing to gather insights that inform design decisions. Design Solutions: Developing  and designing user-centered solutions that enhance the overall user experience. Create wireframes, prototypes, and mockups to visualize design concepts and interactions. User Testing: Planning and executing usability testing to validate design choices and gather feedback. Analyze test results to refine and improve the design, ensuring it meets user needs and expectations. Collaboration: Working closely with product managers, developers, and other stakeholders to align design solutions with business goals and technical constraints. Facilitate design reviews and integrate feedback into the design process. Design Documentation: Creating and maintaining detailed design documentation, including user flows, wireframes, prototypes, and style guides. Ensure consistency and clarity in design specifications for implementation. Design Strategy: Contributing to the development of UX design strategies and guidelines that align with client objectives and industry best practices. Stay informed about UX trends and emerging technologies to apply innovative approaches. Problem Solving: Identifying and addressing usability issues and design challenges throughout the project lifecycle. Providing creative solutions that balance user needs, business goals, and technical feasibility. What was the salary of the individual they hired? Eric was hired for a monthly salary of about ¥23,000 RMB ($3,235 USD). What was the candidate’s background before being hired? Eric holds a bachelor’s degree in User Experience Design and had 3+ years of working experience in a similar B2B industry as a designer. Eric was fluent in English and Mandarin, as well as Javascript and HTML/CSS.   Need to hire someone like this too? If your team is looking to hire in China, we can help – and likely lower your hiring costs by over 80%. Our China Candidate Sourcing service helps companies promote across leading Chinese jobs & networking platforms to find great talent for roles just like this one. Contact us to discuss hiring goals, salary & compensation budgets in China, and if TeamedUp China is the right fit to support your organization. Book A Call Post a Job We’ve been recruiting in China since 2014! Let’s find your next great China-based team member together.  Edit Template

How a Product Development Firm Hired a UX Designer in China Read More »

Average Salary in Beijing China - TeamedUp China

Average Salary in Beijing China: Local Data Breakdowns (2024)

Beijing is the second highest-paying city in China (second only to Shanghai). Today we’re breaking down multiple sources of public, local data to see what the average salary level really is in this megacity.  So let’s get to it! A dive into some 2024 Beijing salary data…   💡 Why not use data from international sources, you ask? When it comes to salary figures in China, we’ve found a big discrepancy in the data provided by most outlets. Hiring in China? We can help. Post open roles across China’s top job sites, classifieds, and networking platforms — lower hiring costs by over 80%. Edit Template Average Salary in Beijing: Government Data Human Resources Bureau Stats In July 2024, Beijing’s Human Resources & Social Security Bureau[1] released its most recent data on urban salaries. Here are the figures they put out: Average annual income: ¥141.132 RMB ($19,865 USD) Average monthly income: ¥11,761 RMB ($1,655 USD) Public, Private, and Corporate Salaries In this same release, the bureau broke down average wages for public (government) workers, private (all non-government workers), and corporate (specific section of private) workers:   Public jobs Average annual income: ¥188,413 RMB ($26,520 USD) Average monthly income: ¥15,701 RMB ($2,210 USD)   Private Jobs Average annual income: ¥105,931 RMB ($14,910 USD) Average monthly income: ¥8,828 RMB ($1,242 USD)   Corporate Jobs Average annual income: ¥186,020 RMB ($26,183 USD) Average monthly income: ¥15,502 RMB ($2,182 USD)   Data considerations: Coming from an official government bureau, this release uses data reported by firms for Social Insurance purposes. In practice, firms may compensate employees in other ways that are not considered in these figures. Examples of this include things like commissions, bonuses, alternative perks, and offering extra social insurances. Beijing Historic Salary Growth In the 2023 bureau report, the average monthly salary was listed as ¥11,297 RMB ($1,590 USD), an increase of 4.11% from the previous year into 2024.  If we look further back into the bureau’s reports, the average wage in Beijing has risen rapidly over the last several years: Average Salary in Beijing: Local HR Data Beijing Salary Data (Zhilian Zhaopin) Local HR giant Zhaopin regularly releases salary data for 38 core cities across China. The above photo shows these top cities’ average and median salary levels in Q2 2024. Beijing has held the second spot on this list for quite some time and comes in at the #2 spot again with an average monthly salary of ¥13,351 RMB ($1,879 USD)/month. Beijing’s median salary for Zhaopin’s data set is ¥11,001 RMB ($1,548 USD)/month.   Compared to Other Top Cities Shanghai took the first spot with an average monthly salary of ¥13,732 RMB ($1,933 USD)/month. Shenzhen ranked third with an average monthly salary of ¥12,774 RMB ($1,780 USD)/month. Hangzhou, Nanjing, Suzhou, Guangzhou, and Ningbo round out the top 8. We also have median salary data here and can see the median of the top 3 cities – Shanghai, Beijing, and Shenzhen – all exceeded ¥10,000 RMB ($1,393 USD)/month. It’s also interesting to note that there is a 59% difference in the median salary between the first (Shanghai) and last (Harbin) cities on this list. Related Resources: Average Salary in Shanghai China: Local Data Breakdowns (2024) Salary Data for 8 of China’s Leading Tech Companies (2024) Average Salary Ranges for New University Graduates in China A Guide To The 13th Month Salary Bonus In China Top 10 Highest Paying Cities in China (2024) Average Salary in China: Local Data 2023+2024 Hiring in China? We can help, and likely lower your hiring costs by over 80% We’ve been recruiting in China since 2014! Our China Candidate Sourcing Service helps companies post & promote open roles across top Chinese jobs & networking platforms. Let’s find your next great China-based team member together.  Book A Call Post a Job Contact us to discuss hiring goals, salary & compensation budgets, and if TeamedUp China is the right fit to support your organization. New here? Get 26% off your first job post with us. Edit Template

Average Salary in Beijing China: Local Data Breakdowns (2024) Read More »